Briefly, the strategy is to do the following processing steps on the first spectrum (#0 titration) without the ligand, export the commands to a new macro, and apply that macro to the other spectra of this titration. You can then just modify the PHC0{F2} and apply the same macro to all other ligand titration spectra you measured for that protein.
- Execute
biotopand set the parameters for referencing as described in this tutorial. - Once ready, click Close and execute the command:
Below are the commands and s brief description of each step:
btproc biorefonly # referencing
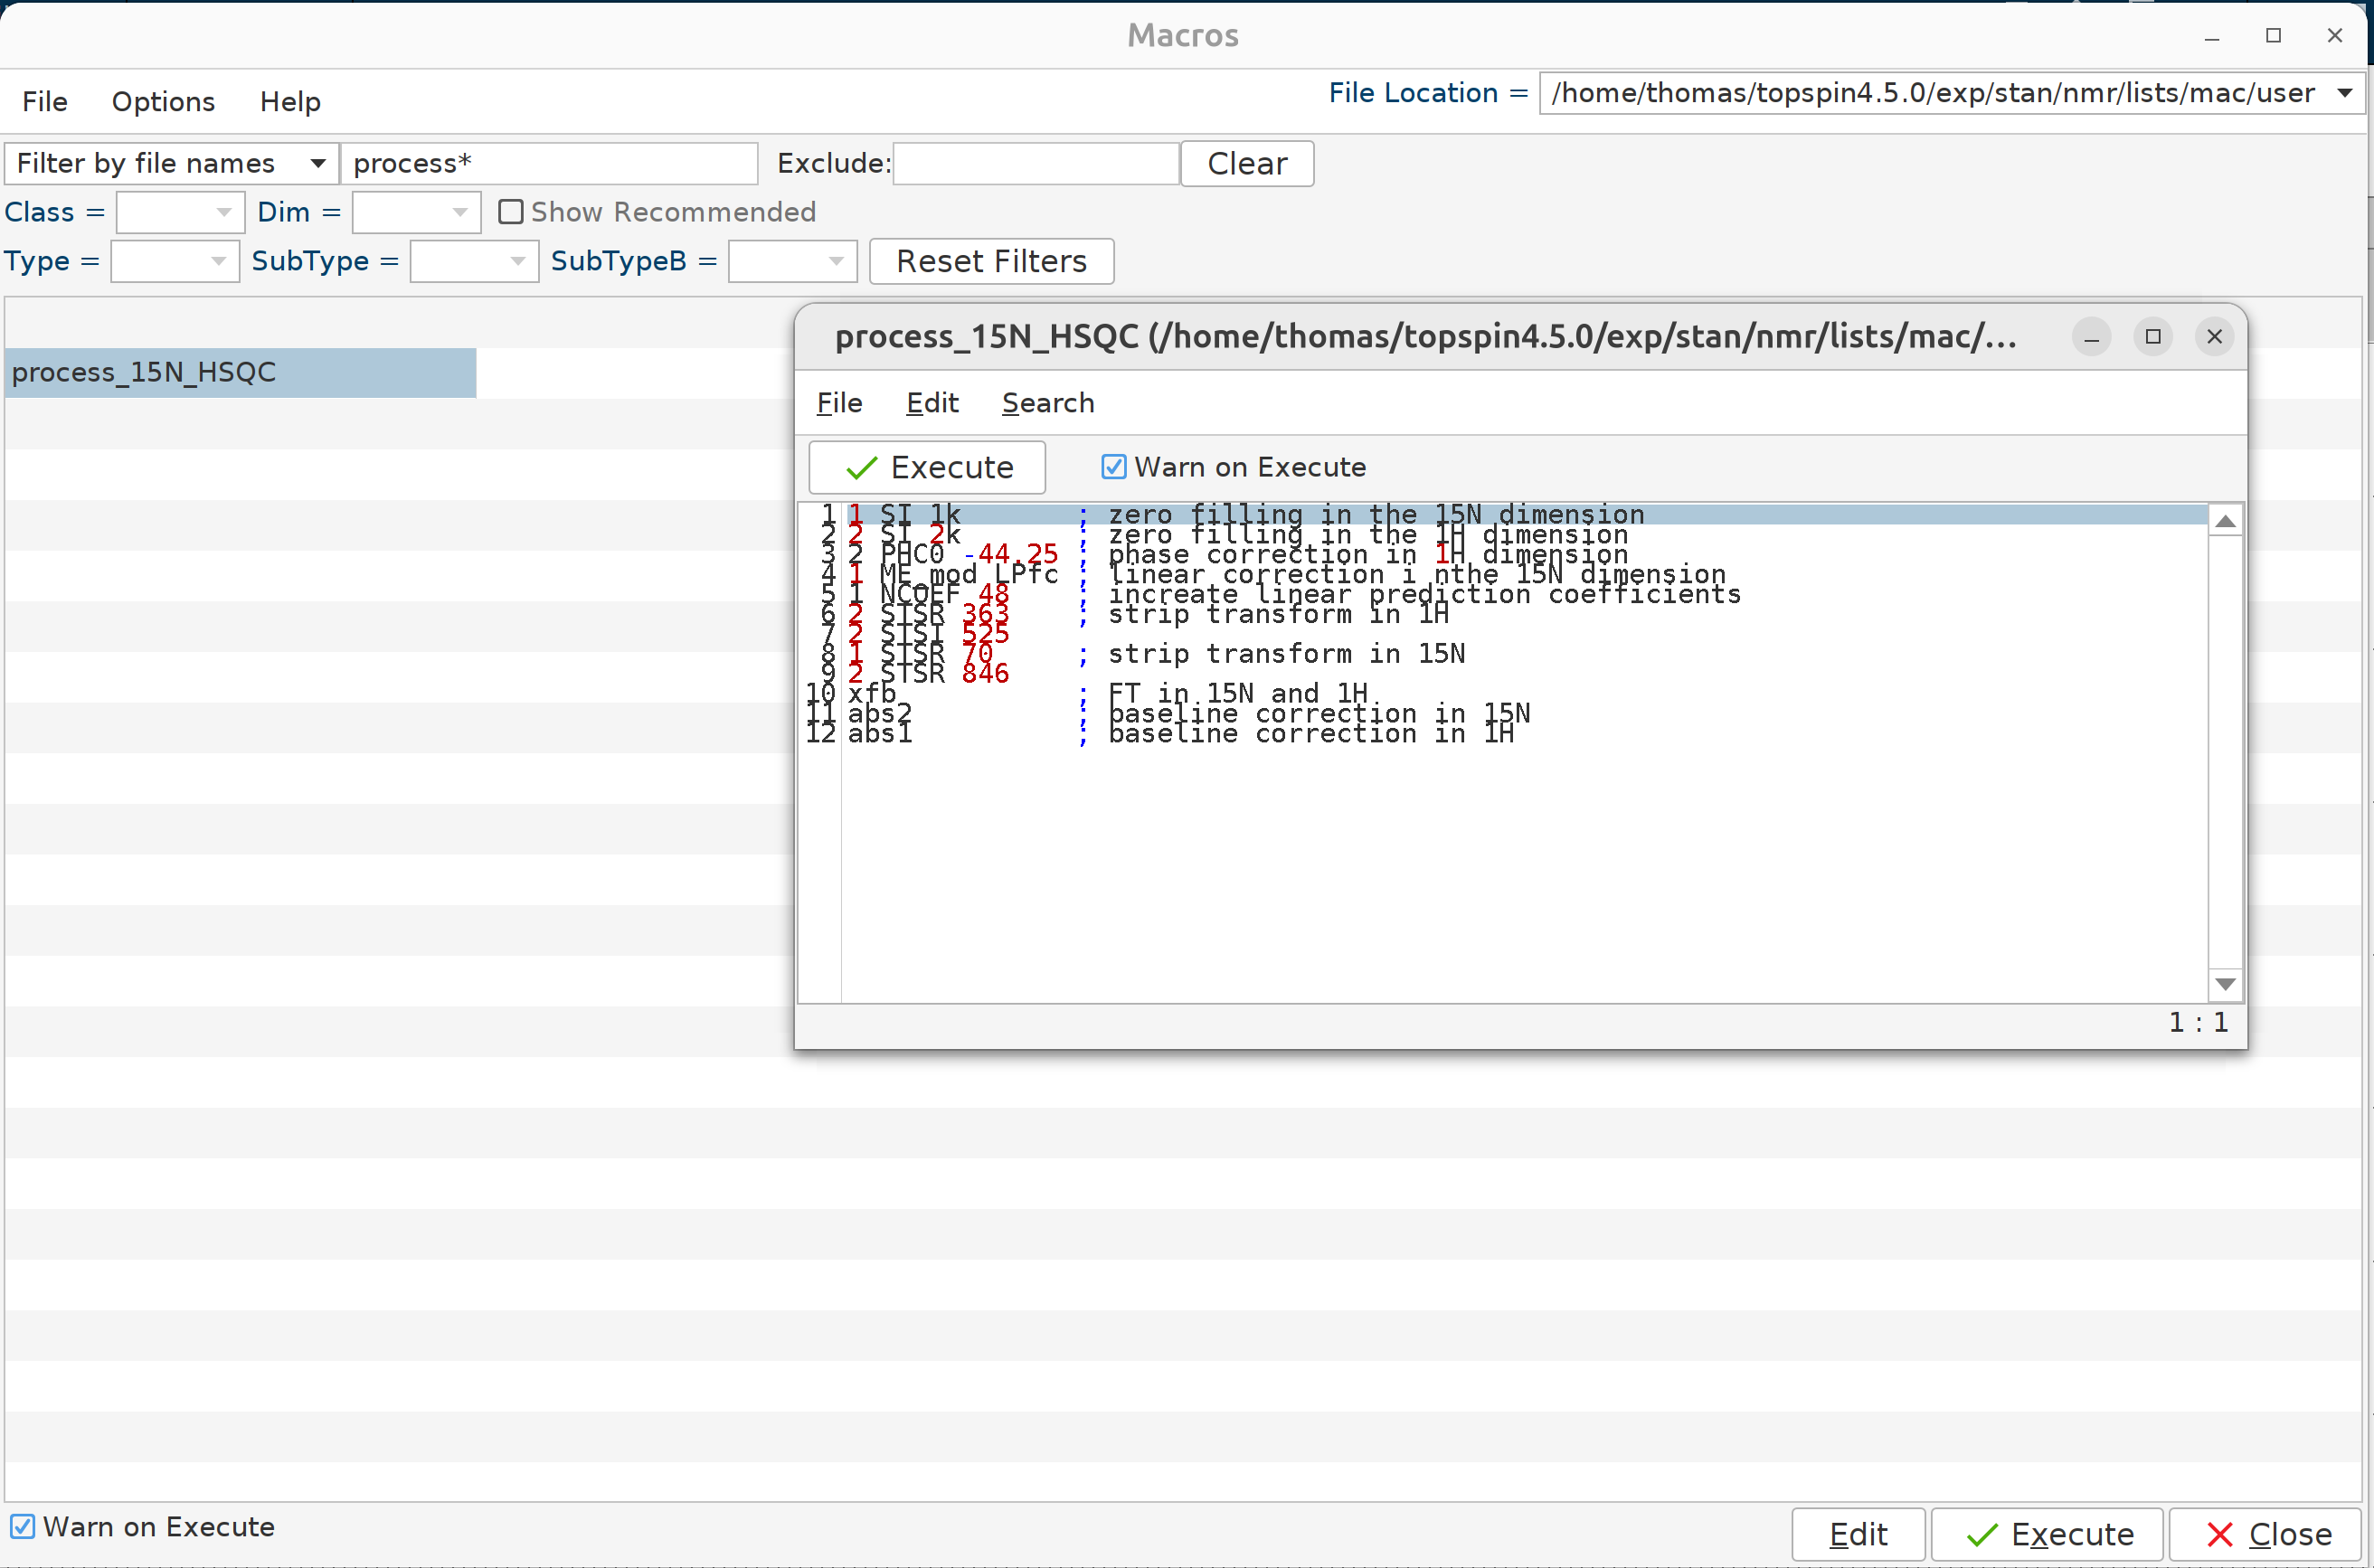
1 SI 1k # zero filling in the 15N dimension
2 SI 2k # zero filling in the 1H dimension
2 PHC0 -44.25 # phase correction in 1H dimension
1 ME_mod LPfc # linear correction i nthe 15N dimension
1 NCOEF 48 # increate linear prediction coefficients
2 STSR 354 # strip transform in 1H
2 STSI 546 #
1 STSR 66 # strip transform in 15N
1 STSI 860 #
xfb # FT in 15N and 1H
abs2 # baseline correction in 15N
abs1 # baseline correction in 1H
Hit edmac to open the macro window, select the user macros folder at the top right and add a new macro named
process_15N_HSQC as shown in the figure.
Finally, process all spectra in batch mode with the qumulti command. In the window that will pop up write
process_15N_HSQC as the command and select the individual experiments that you want to process.
E.g., 153, 155, 157, 159, 160.
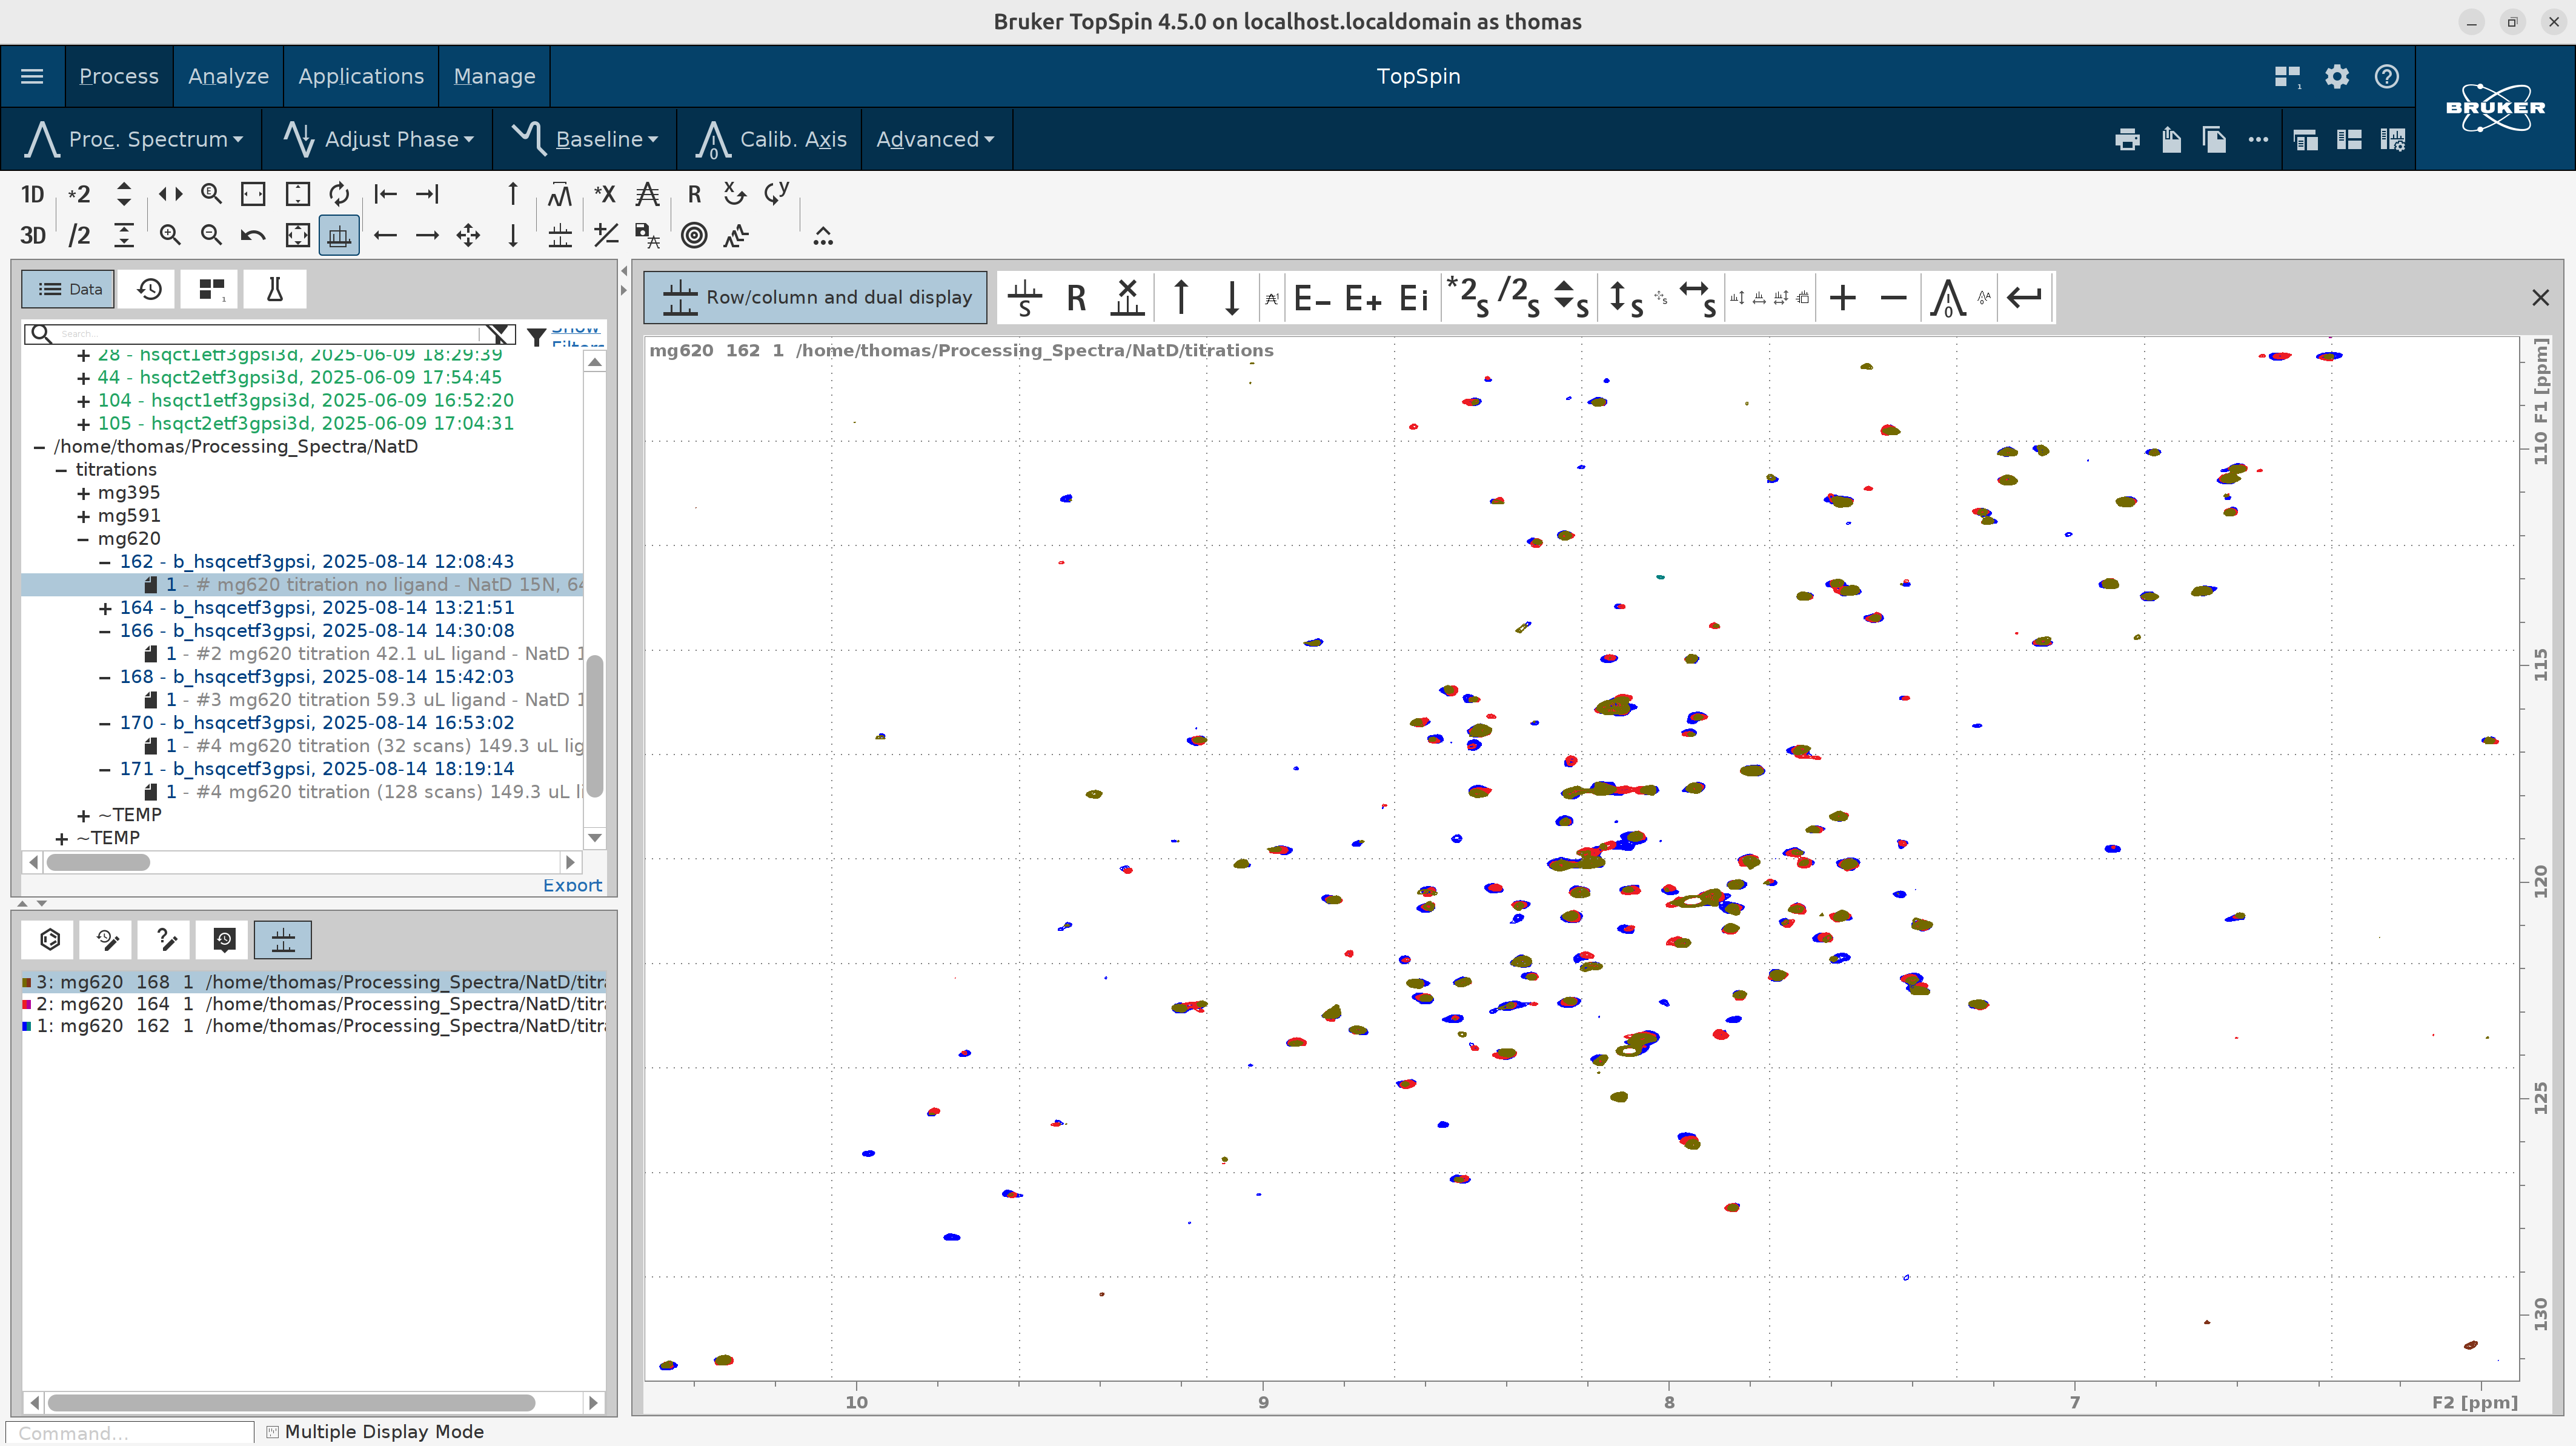
To visualize, edit the contour levels as described in this tutorial. Below I overlay 3 titration spectra for clarity.
Authors
- Thomas Evangelidis