Phase Correction in 4D Protein Spectra
The following tutorial refers to the 4D HCNH NOESY spectrum type but the same procedure can be applied for other 4D spectra. Specifically for 4D HCNH NOESY, we need to phase only the F4(PCH0) value. There are several ways to do that. I strongly recommend using the combination of SOLUTIONS 1-3 for certainty.
Table of contents
-
Solution 2: Phase-Correct the Measured 2D Plane of the 4D Spectrum
-
SOLUTION 3: Phase-Correct the F3-F4 Sum Projection of the 4D Spectrum
-
SOLUTION 4: Phase-Correct the F3-F4 Projections’ Sum of the 4D Spectrum
Tested environment:
- Topspin 4.4.0 with commercial license for NUS processing
- OS: AlmaLinux 9 (as an Oracle virtual machine)
- 20 CPU cores, 120 GB of RAM.
Solution 1: Phase-Correct the 1st FID
Example Data: (13C)HSQC-NOESY-(15N)HSQC on human Carbonic Anhydrase II (850 MHz)
- Reset all F4 phase values to
0:Important: Look at the bottom of the pulse program to find the correct PHC0 and PHC1 values of F1-F3 - if there are any. Read the NUS-reconstruction tutorials for details. Briefly the pulse programs
hsqcnoesyhsqccngp4dandnoehcnhwg4d_noverequire zero values, whilesfhmqc_noe_sfhmqc_4Dhcnh.flthe following:F4 F3 F2 F1 PHC0 90 90 -45 PHC1 0 -180 -180 0
Where P0 is the value you will find after phase correction.
- Unless you use
sfhmqc_noe_sfhmqc_4Dhcnh.fl, set all phase values to zero with the following command:4 PHC0 0 4 PHC1 0 3 PHC0 0 3 PHC1 0 2 PHC0 0 2 PHC1 0 1 PHC0 0 1 PHC1 0
- Extract the 1st FID:
- Open the raw 4D spectrum and run
rser eao 1to extract the 1st FID (see when to userser 1and whenrser eao 1).
- Open the raw 4D spectrum and run
- Switch to the Frequency Domain:
- Use
ftto switch to the frequency domain.
- Use
- Phase Correction:
- Try first the automated 0th order phase correction with
apk0that will try to create an entirely absorptive lineshape in the spectrum. - If you are not entirely satisfied with the automatic phasing, enter
.phfor manual phase correction. Set the pivot line (right mouse click) near the left limit end to modify onlyPHC0, notPHC1.Note: Adjusting
PHC1(1st order correction) has minimal effect on frequencies near the pivot and no effect onPHC0.
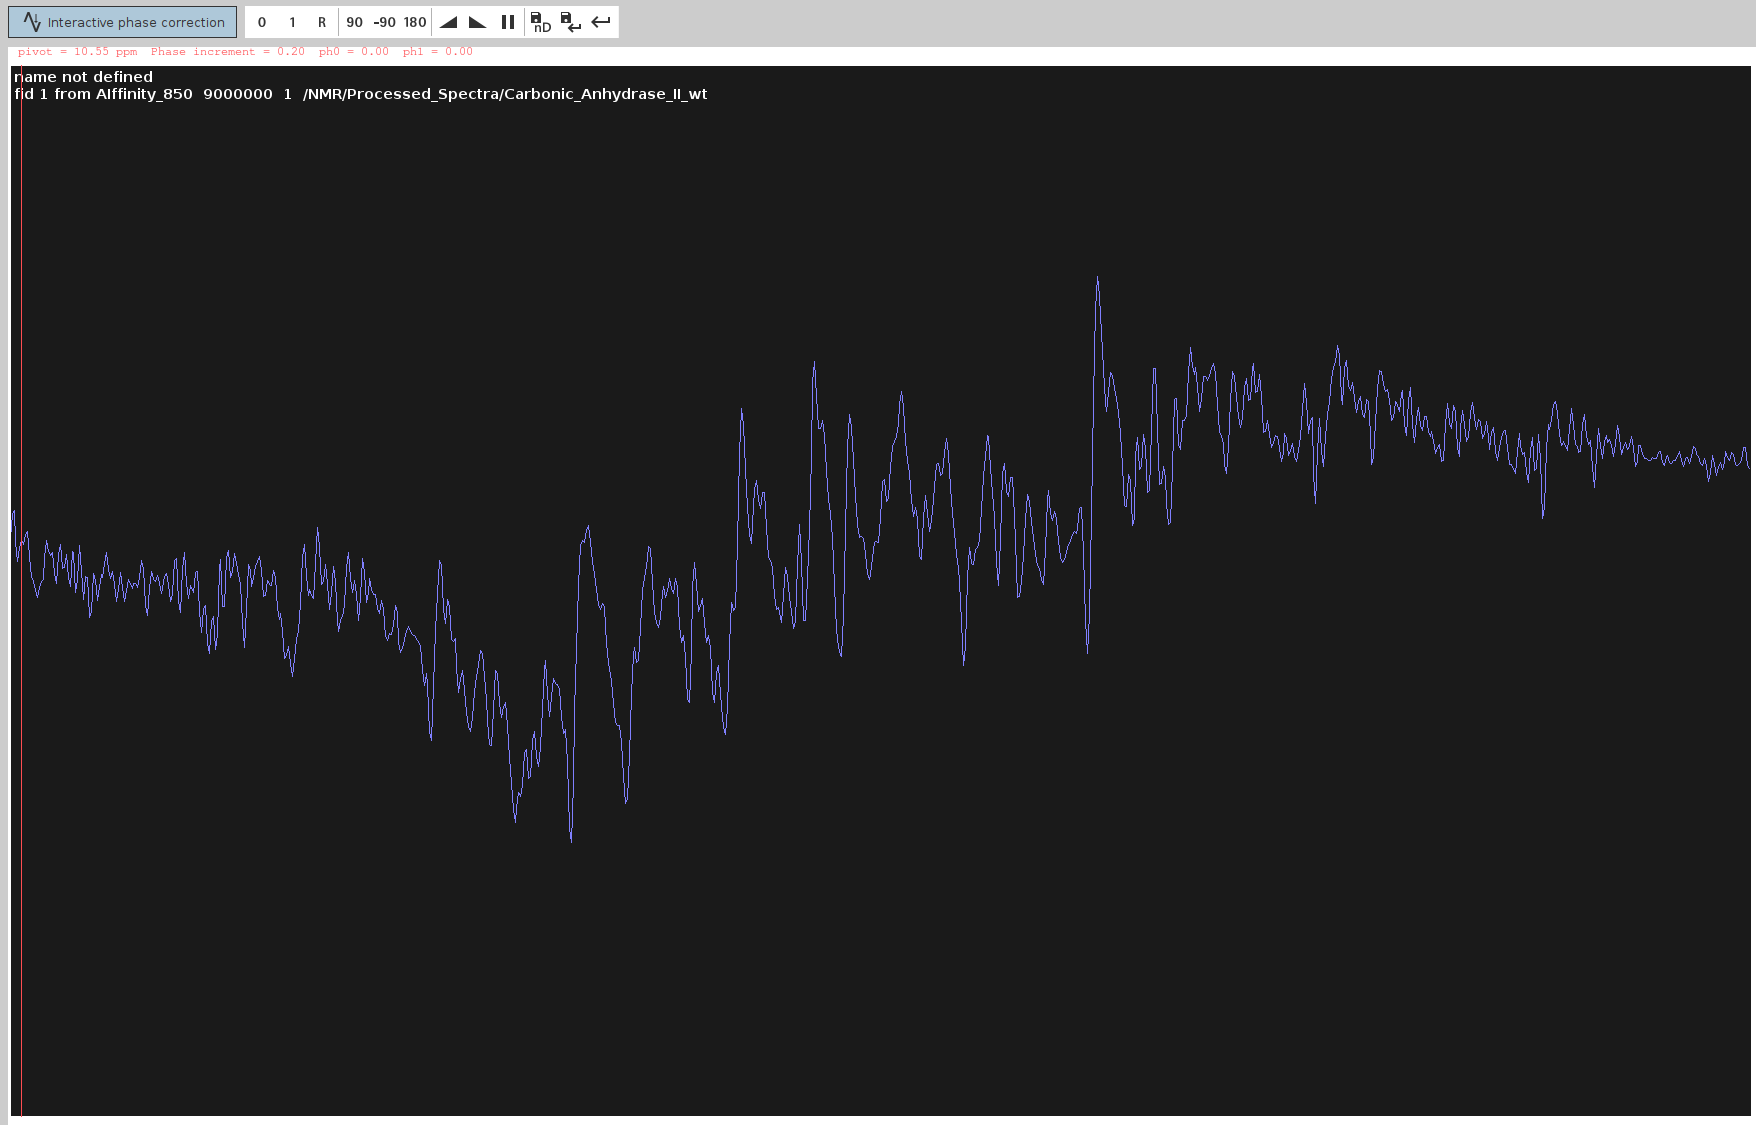
- Try first the automated 0th order phase correction with
- Adjust PHC0:
- Adjust only
PHC0(0th order correction) so the FID line extends straight and the highest peaks point upwards.Note: Avoid using automatic phasing (
apkand its variants) as it generally doesn’t work well.
- Adjust only
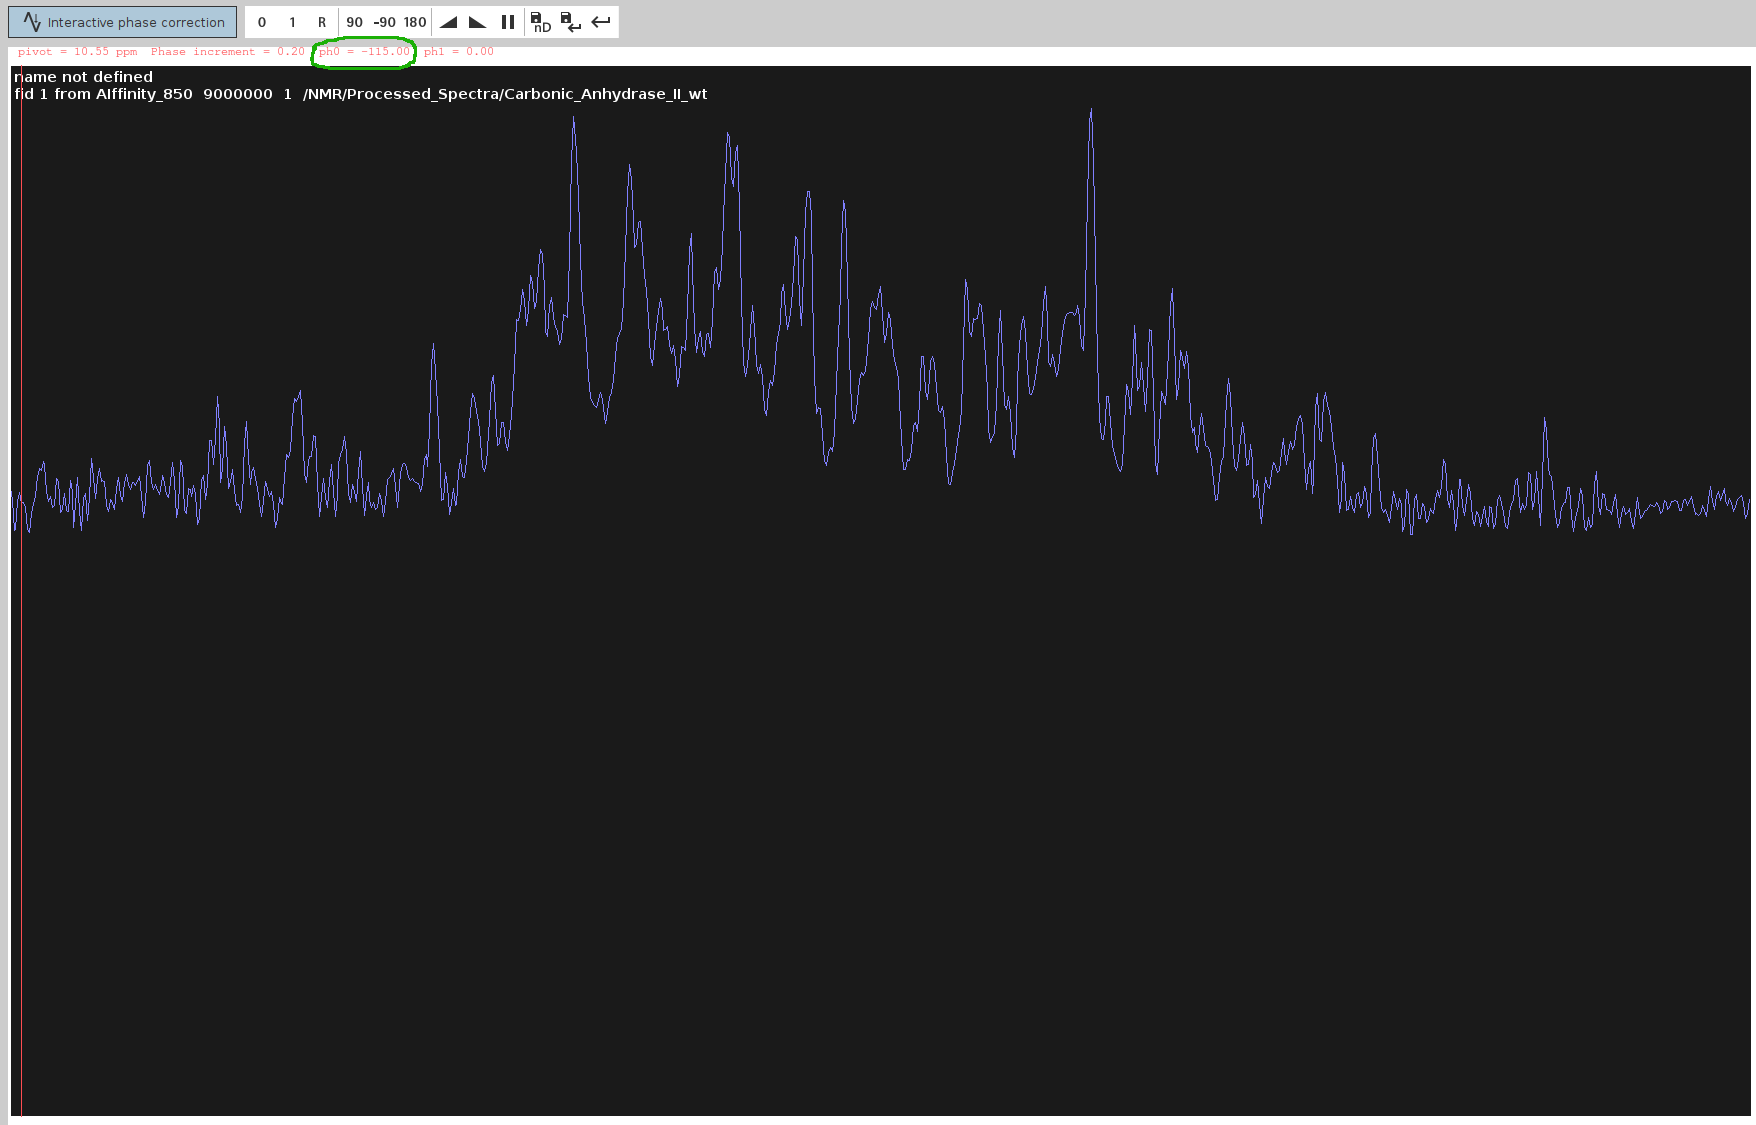
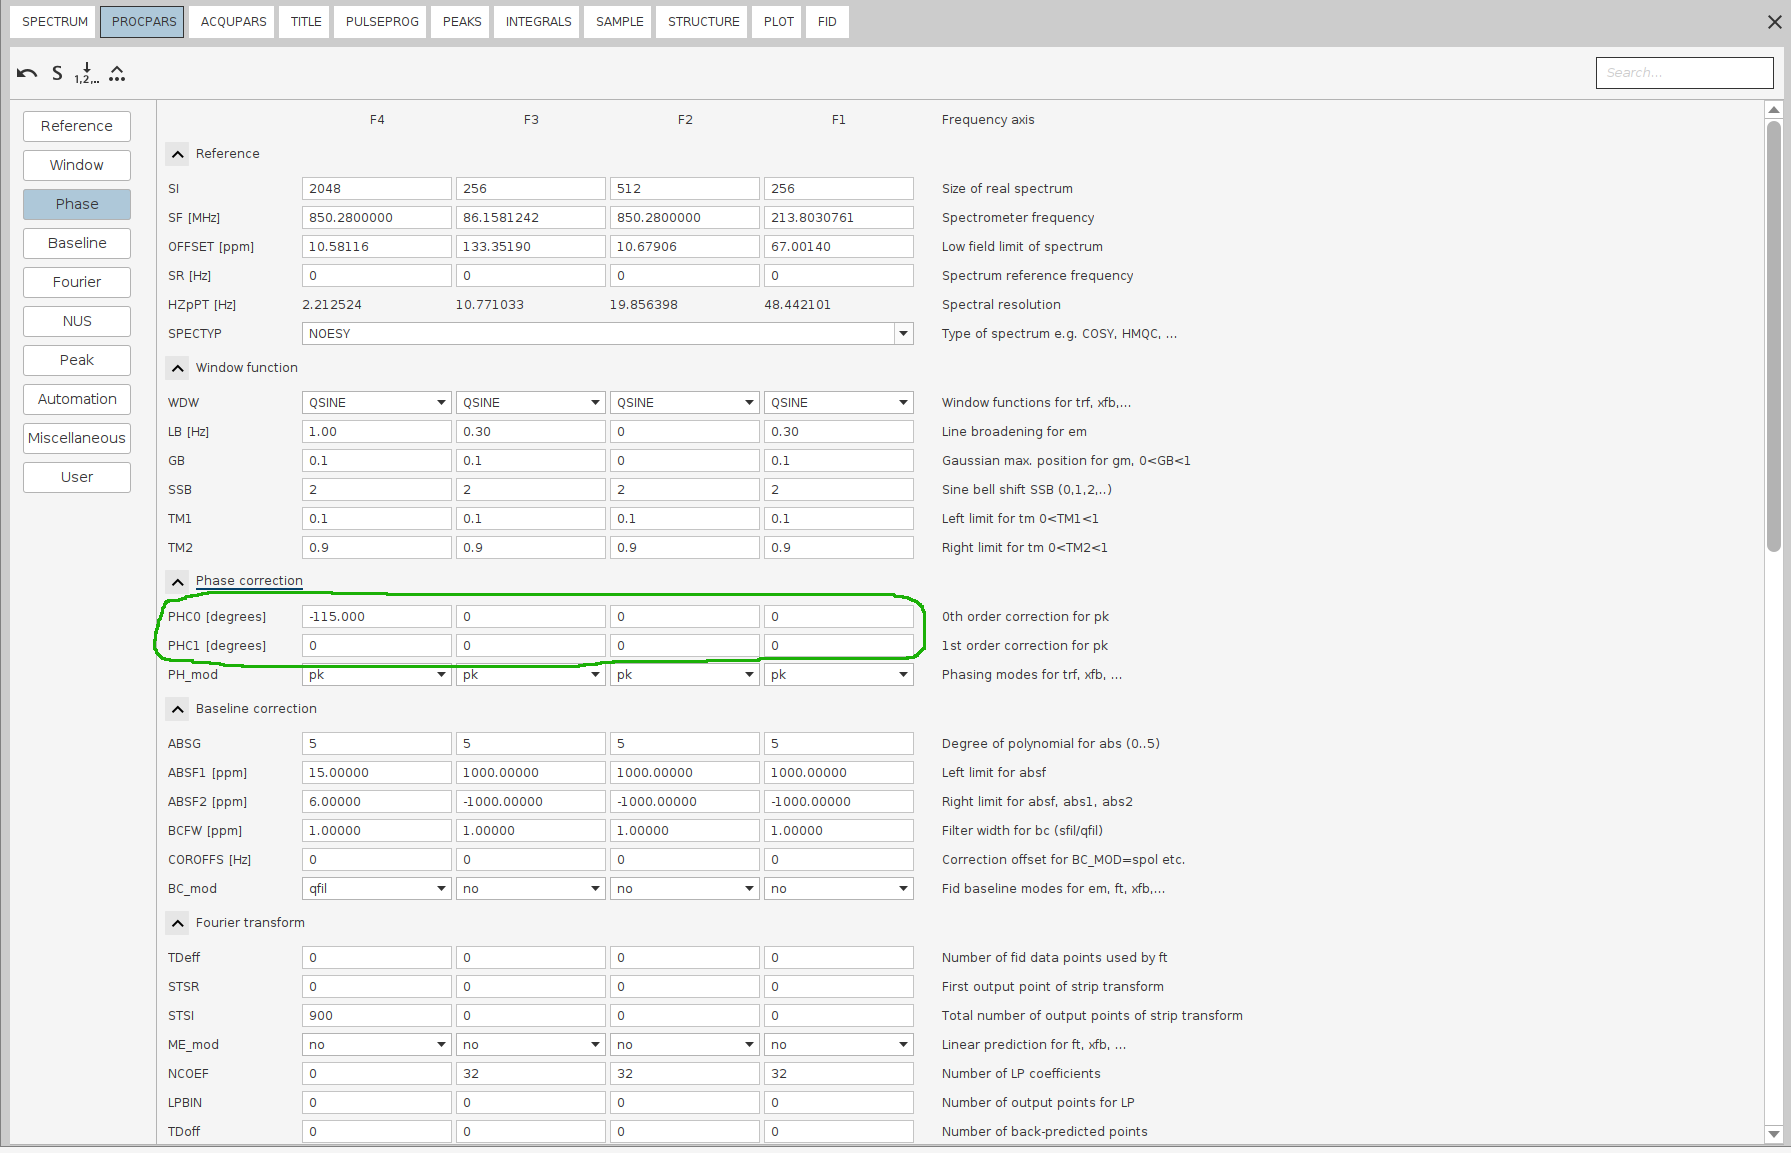
- Save and Apply PHC0:
- Click the Save-disk nD icon to copy the values to the 4D spectrum, then click the Save and Return icon.
Issue
PHC0and note down the value (here,-115.0degrees). Double-click the processed 4D spectrum and ensure allPHC0andPHC1values except for F4 (PHC0) are set to0; unless you used sfhmqc_noe_sfhmqc_4Dhcnh.fl (!).
- Click the Save-disk nD icon to copy the values to the 4D spectrum, then click the Save and Return icon.
Issue
- Initiate NUS-reconstruction:
- Follow the instructions at NUS-reconstruction tutorials. Once all
parameters are set correctly, issue
ftnd 0.
- Follow the instructions at NUS-reconstruction tutorials. Once all
parameters are set correctly, issue
Solution 2 [MOST ACCURATE]: Phase-Correct the Measured 2D Plane of the 4D Spectrum
Example Data: HN plane of a (13C)HSQC-NOESY-(15N)HSQC on human Carbonic Anhydrase II (850 MHz)
This assumes you have measured the F3-F4 (N-HN) plane with the same pulse sequence before recording the whole 4D spectrum.
- Prepare the Experiment:
- Use the F3-F4 plane for phase correction.
- Run
wrpato create a copy of the whole experiment; name it61.
- Transform the 2D Plane:
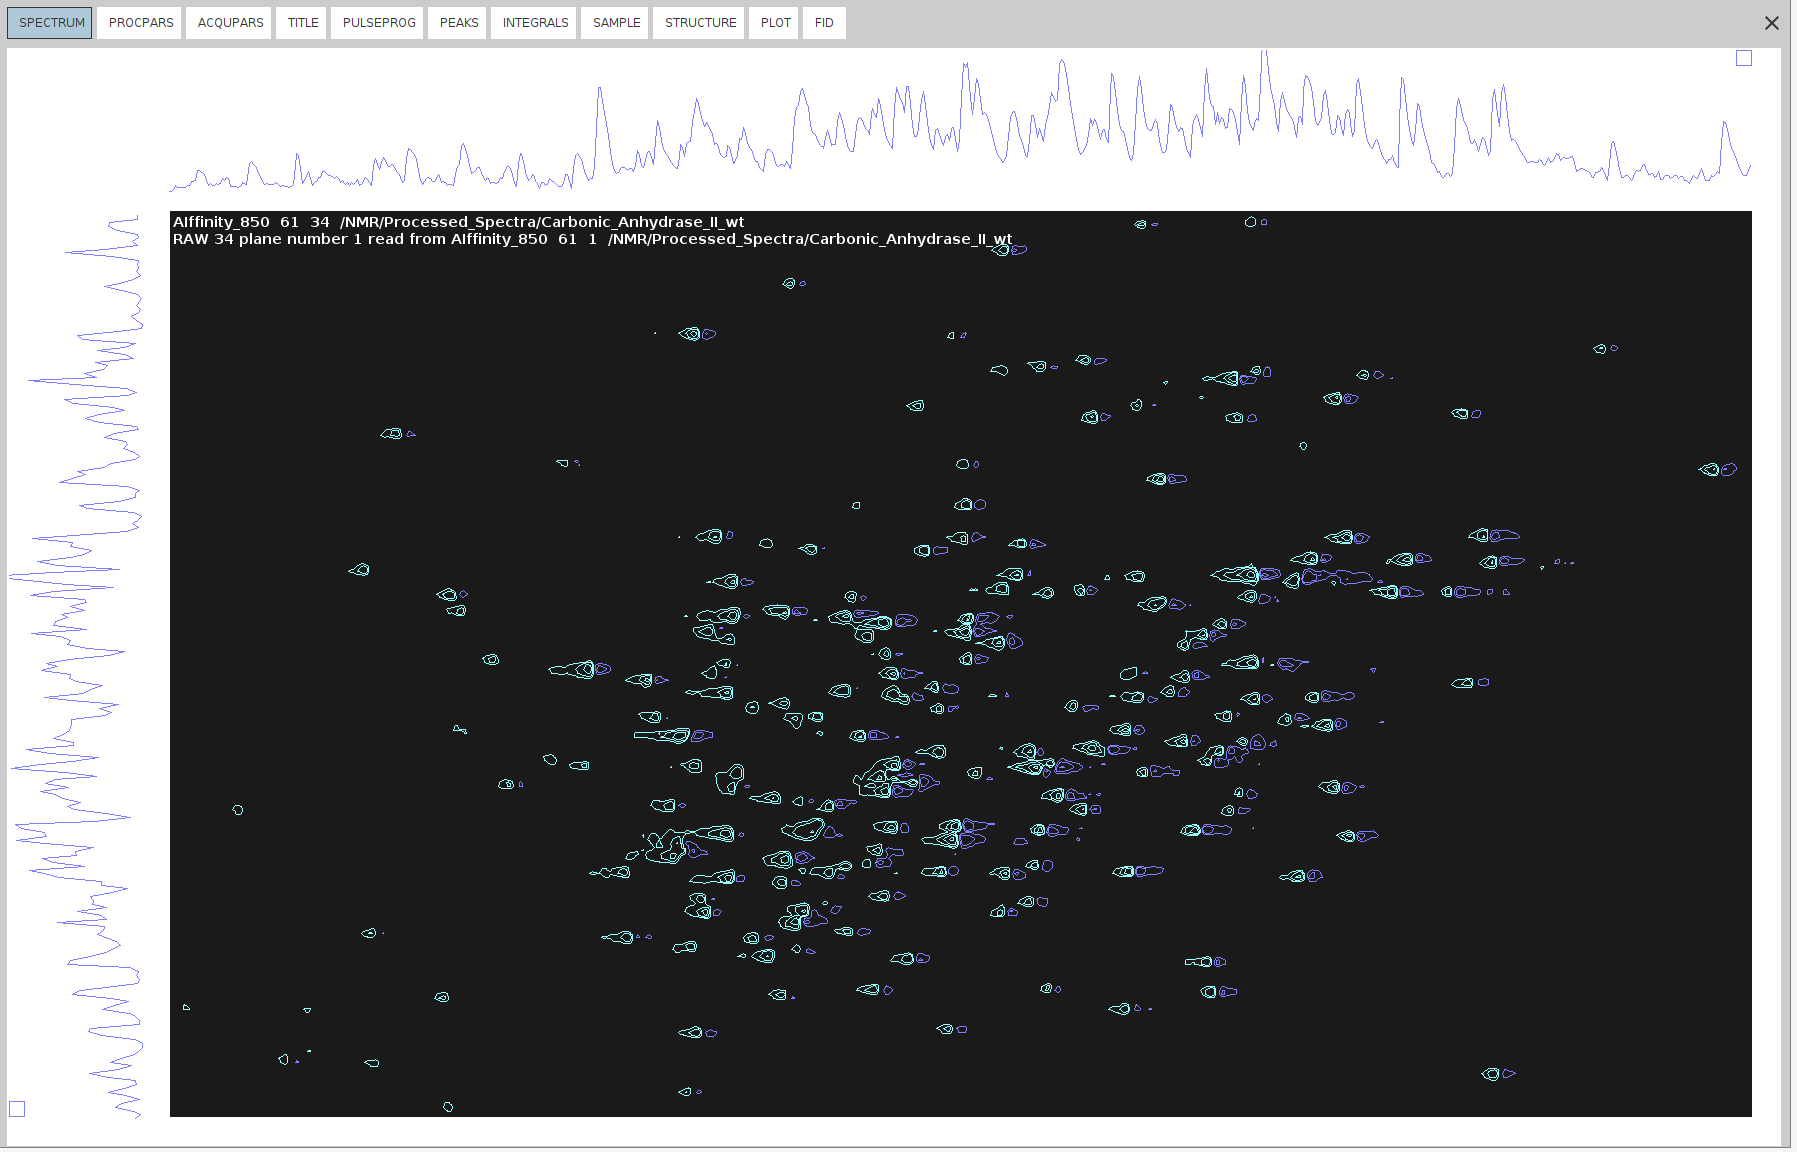
- Open the raw 2D plane in experiment
61and set all phase values to zero with the following command:4 PHC0 0 4 PHC1 0 3 PHC0 0 3 PHC1 0 2 PHC0 0 2 PHC1 0 1 PHC0 0 1 PHC1 0 - Run
xfbfor FT transform.
- Open the raw 2D plane in experiment
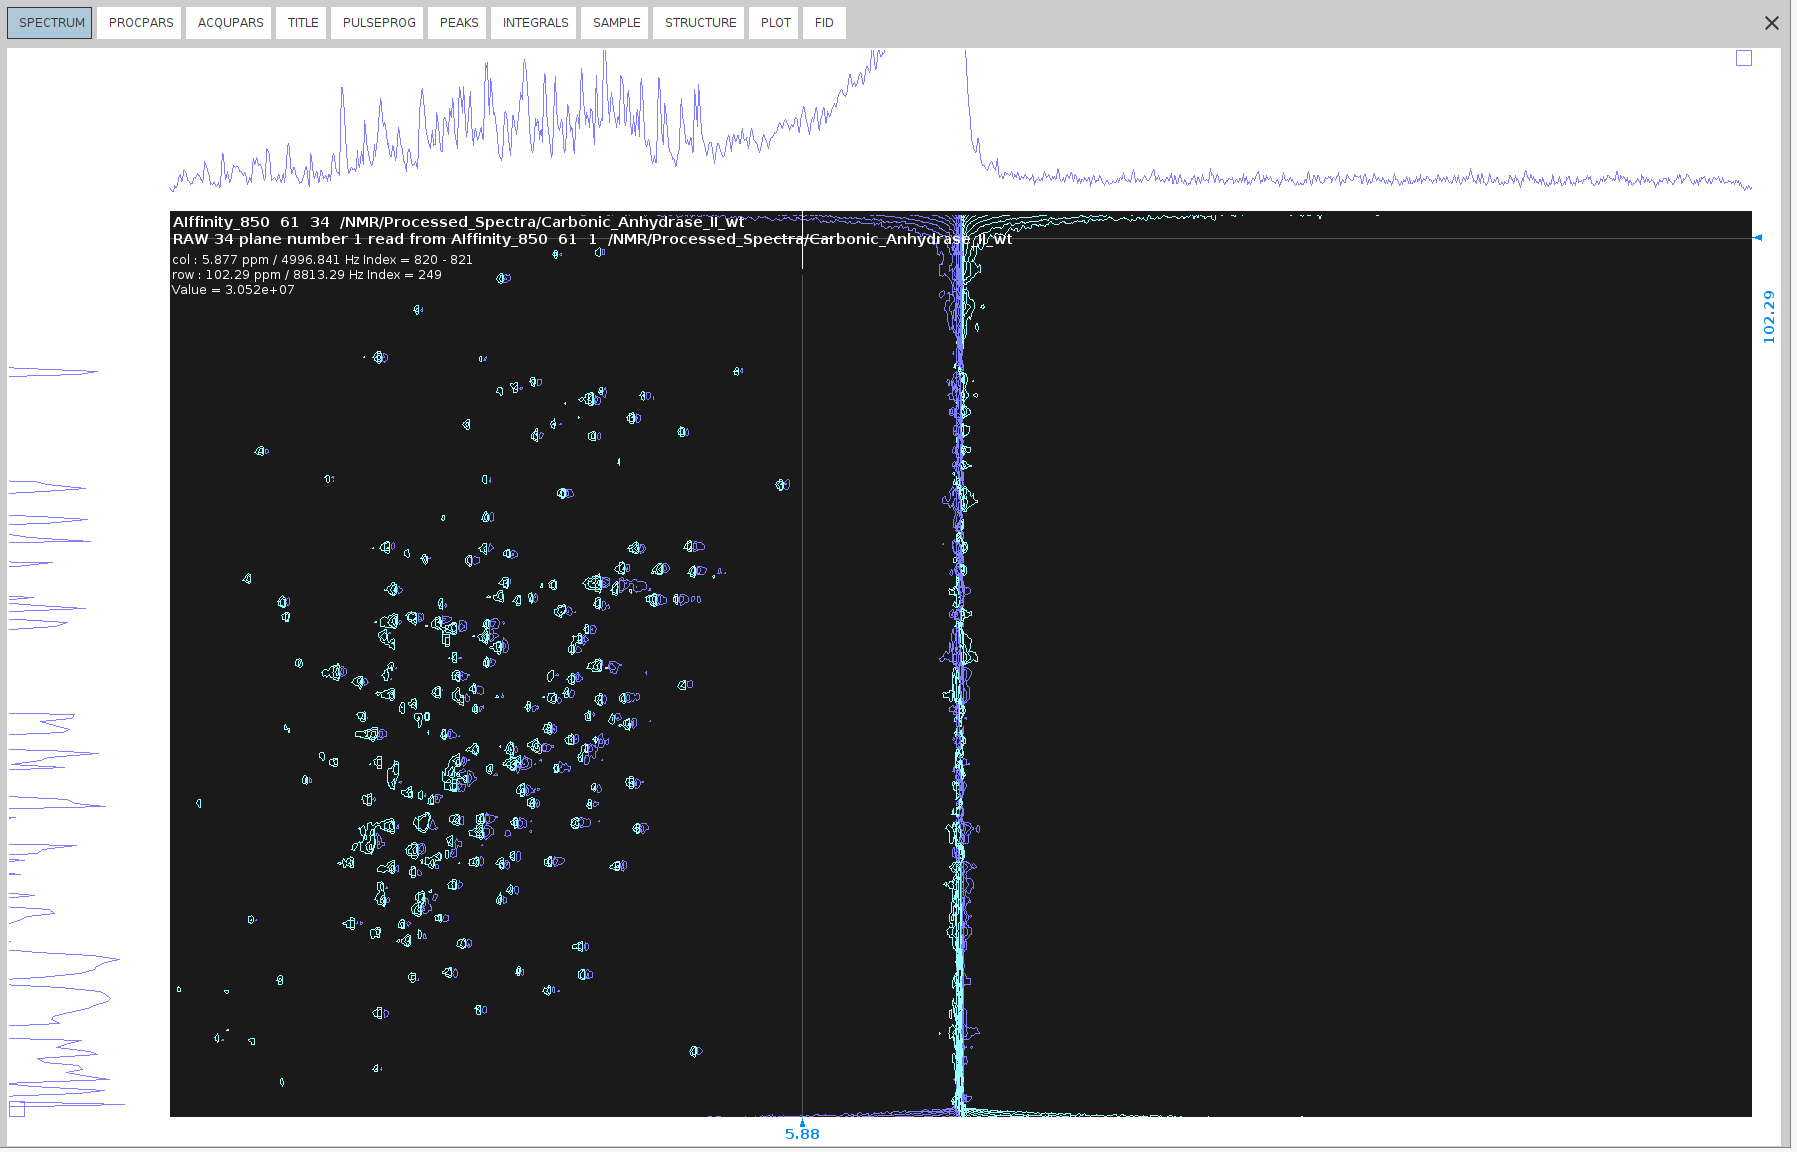
- Select the region of interest (RIO) to zoom in.
- Right-click anywhere on the spectrum and then select
Save Display Region To -> Parameters STSR/STSI (used by strip ft)
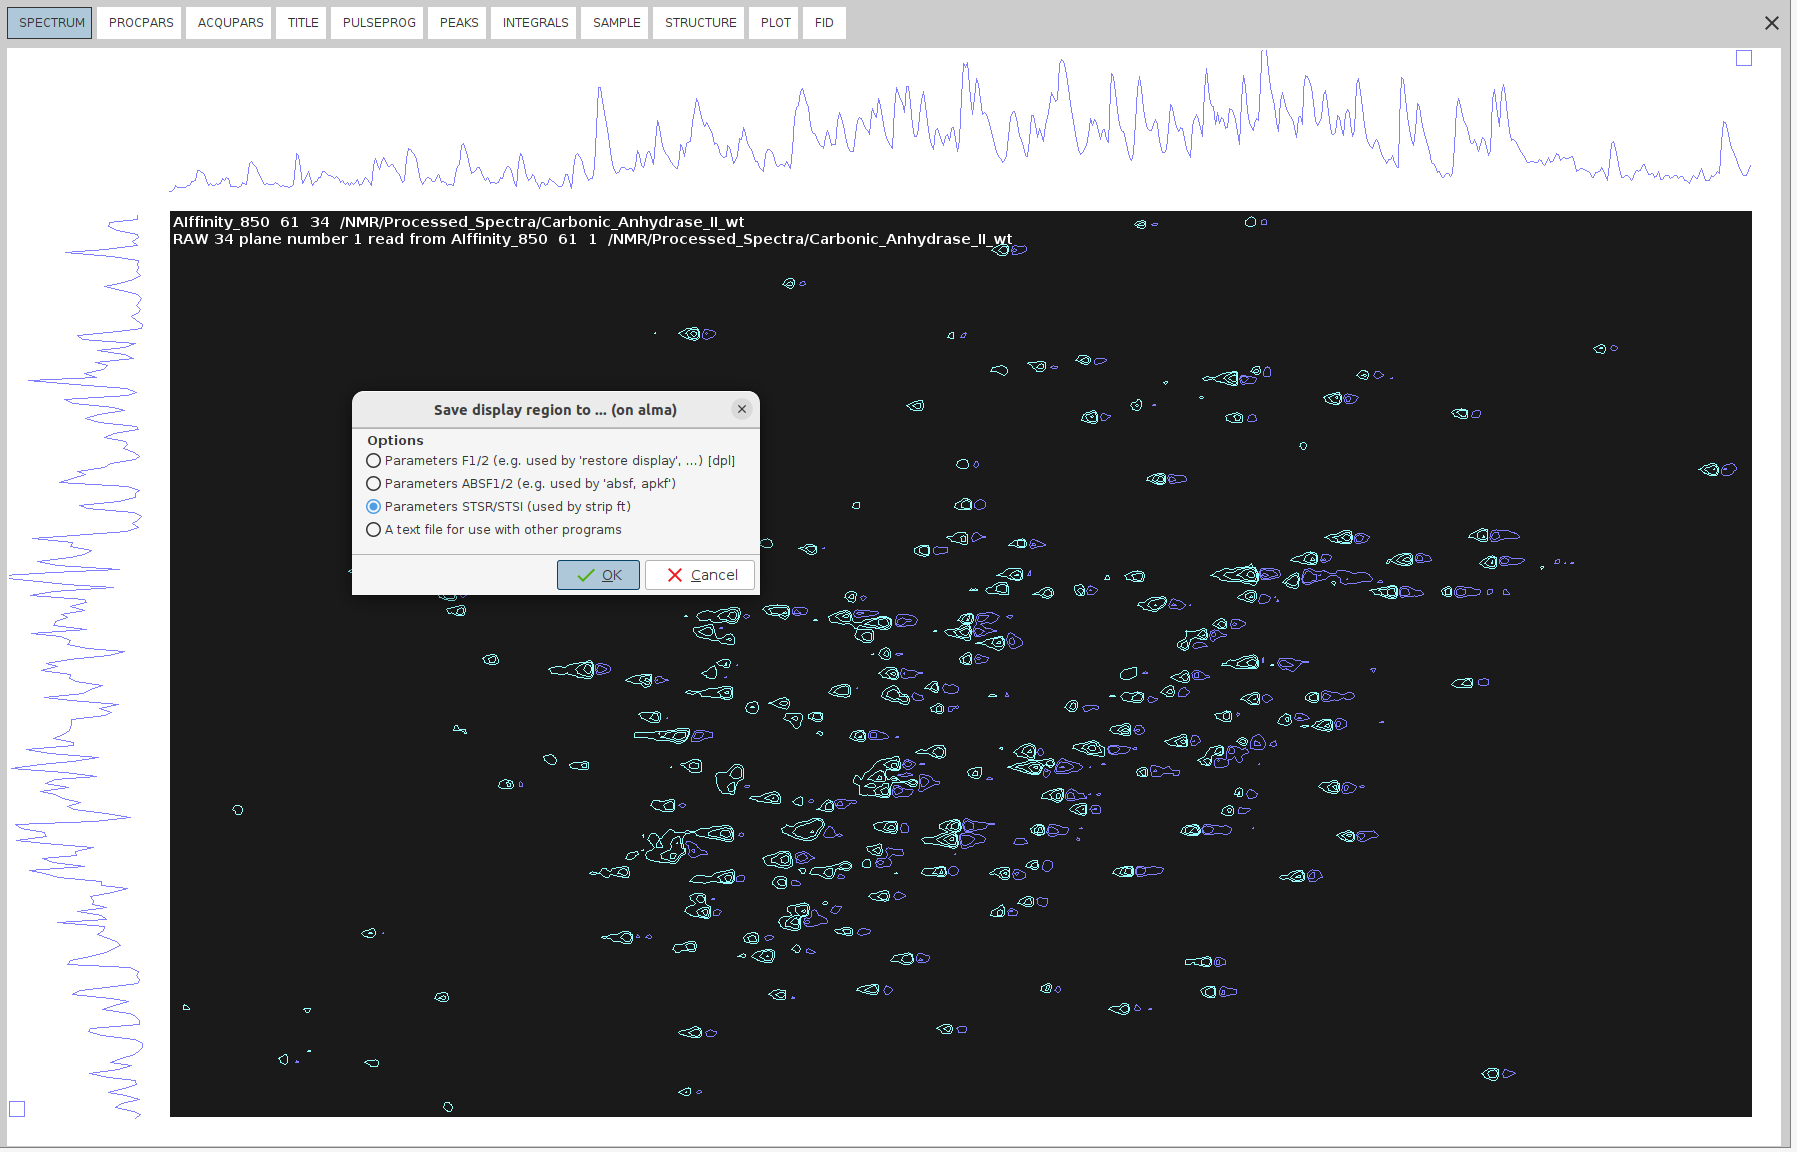
After this, the boundaries of the ROI will appear in STSR and STSI parameters under the PROCPARS tab.
- Right-click again anywhere on the spectrum and this time select
Save Display Region To ->
Parameters ABSF1/2 (e.g. used by 'absf, apkf')
. This is to ensure that the baseline correction takes place downfield (to the left) of the water line (~4.5 ppminHN) to avoid filling the spectrum with noise. - Transfer manually these values to the respective parameters of the 4d spectrum.
- Switch back to the 34 plane and issue the following commands:
1 ABSF1 1000
1 ABSF2 -1000
1 BC_mod no
2 BC_mod qpol
2 SSB 2.2
2 SI SI*2
1 SI SI*4
- These commands have the following effects:
- Leave the default
ABSF1andABSF2values in theNdimension. - Select the
qpolpolynomial function sinceqfilsuppresses water very aggressively and is not recommended for theN-HNspectrum. - Set
BC_modtonoin theNdimension due to its sensitivity to the polynomial. - Set the
SSBof the direct dimension to2.2for further resolution. - Increase the
SIsize of the direct dimension by 2 times to enhance resolution. - Increase the indirect dimension size by four times (zero filling). Ensure that all SI values are powers of 2 (e.g., 1024, 2048, etc.).
- Leave the default
- Execute
xfbfollowed byabs2andabs1for baseline correction. This will remove the irrelevant HN shift region, including the water line, while keeping only the ROI. It will also result in sharper and better-resolved peaks due to zero filling and increased SSB.
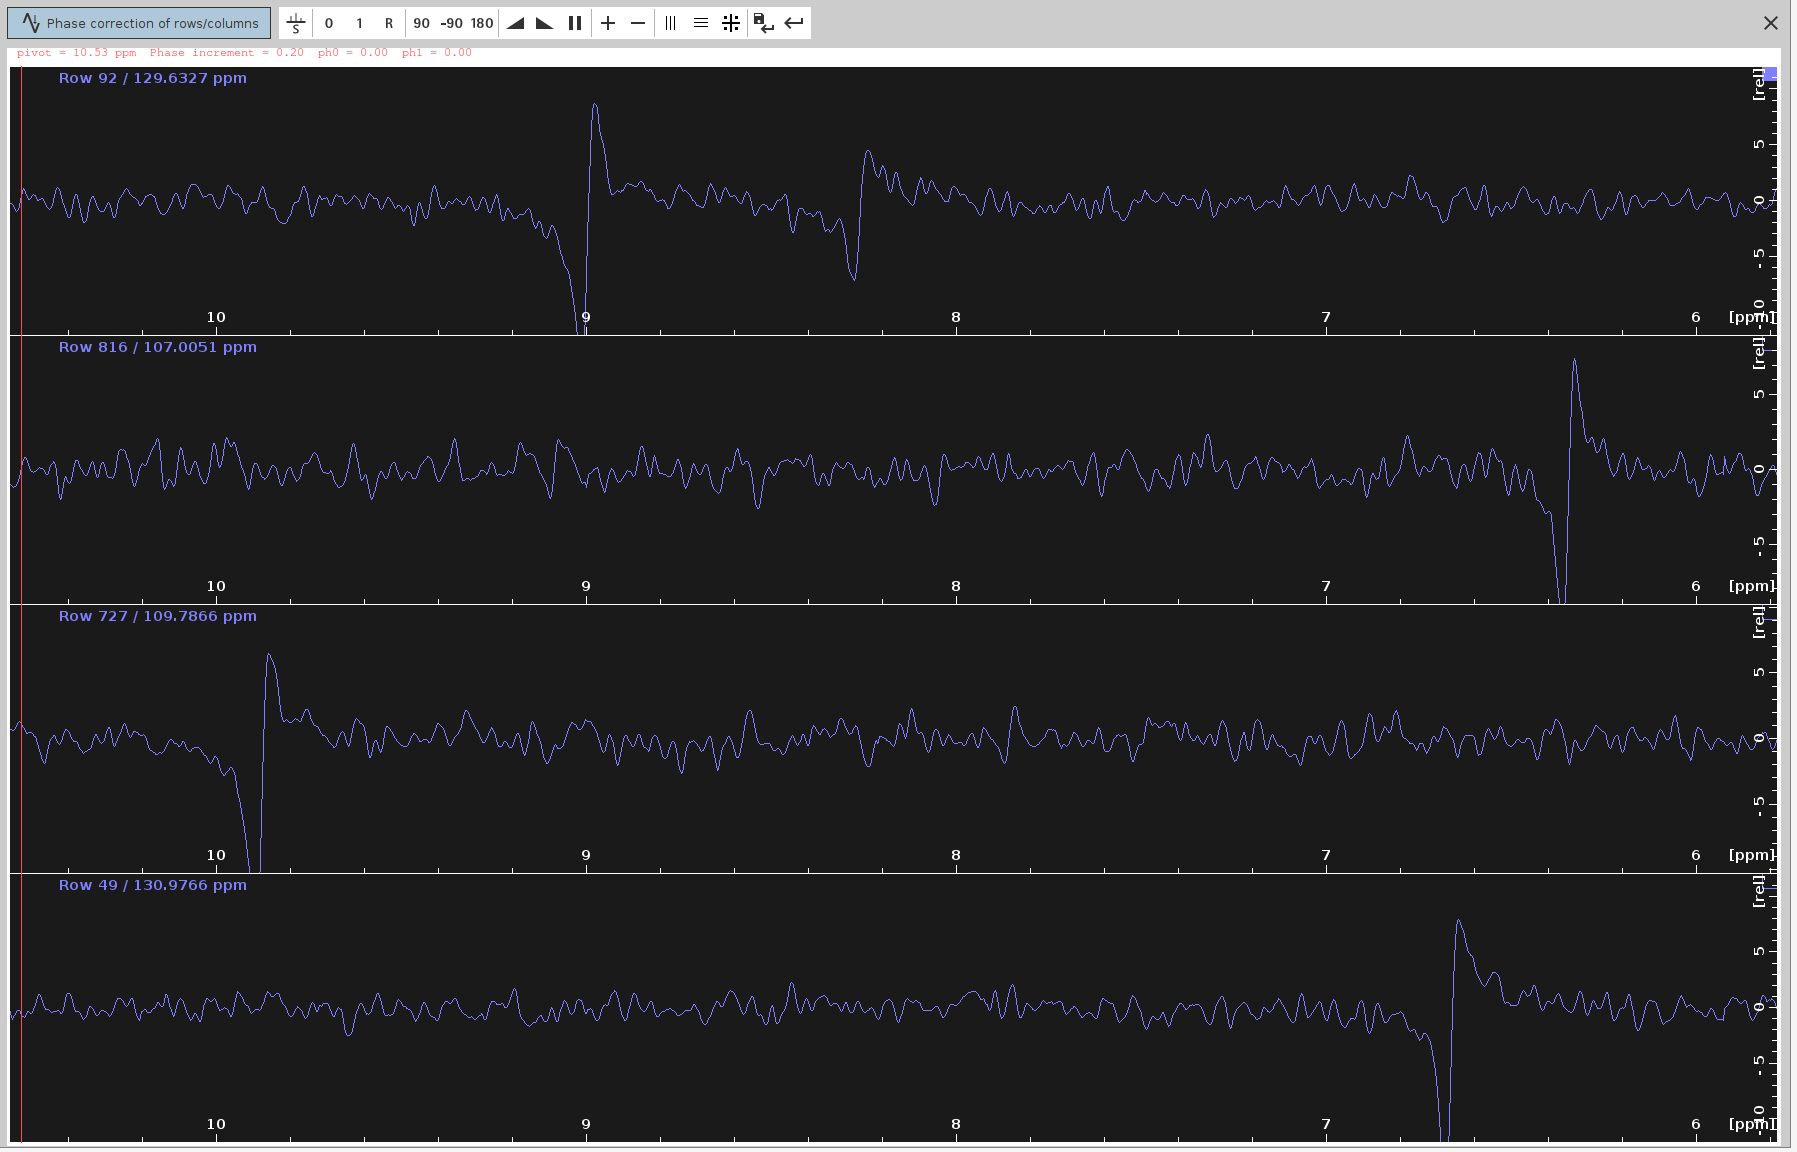
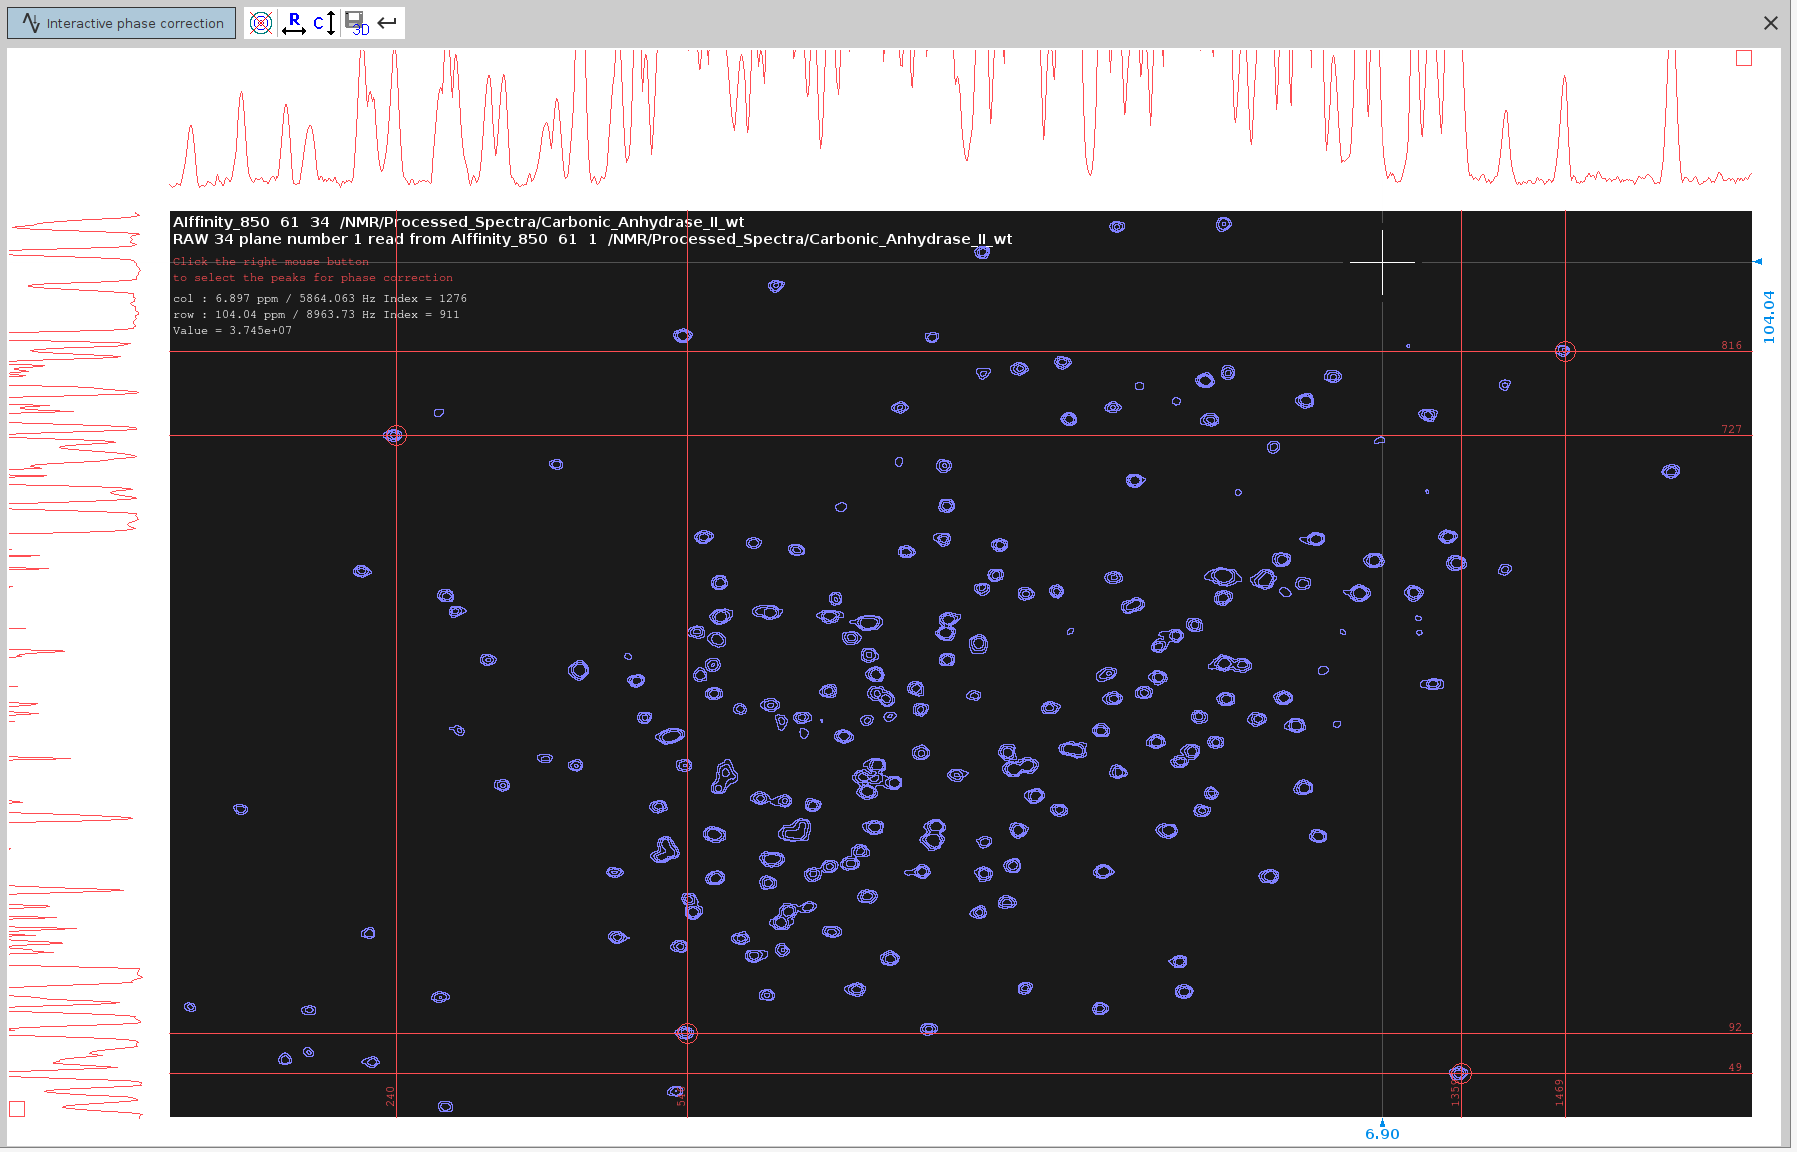
- Prepare for Manual Phase Correction in the F2 dimension:
- Enter
.phfor manual phase correction. - Look for peaks that have an anti-phase component (signals of dispersion character) in the F2 dimension.
- Place the cursor between the centers of these two peaks. Ensure the cursor is along the line connecting them.
- Right-click and select “Add”.
- Enter
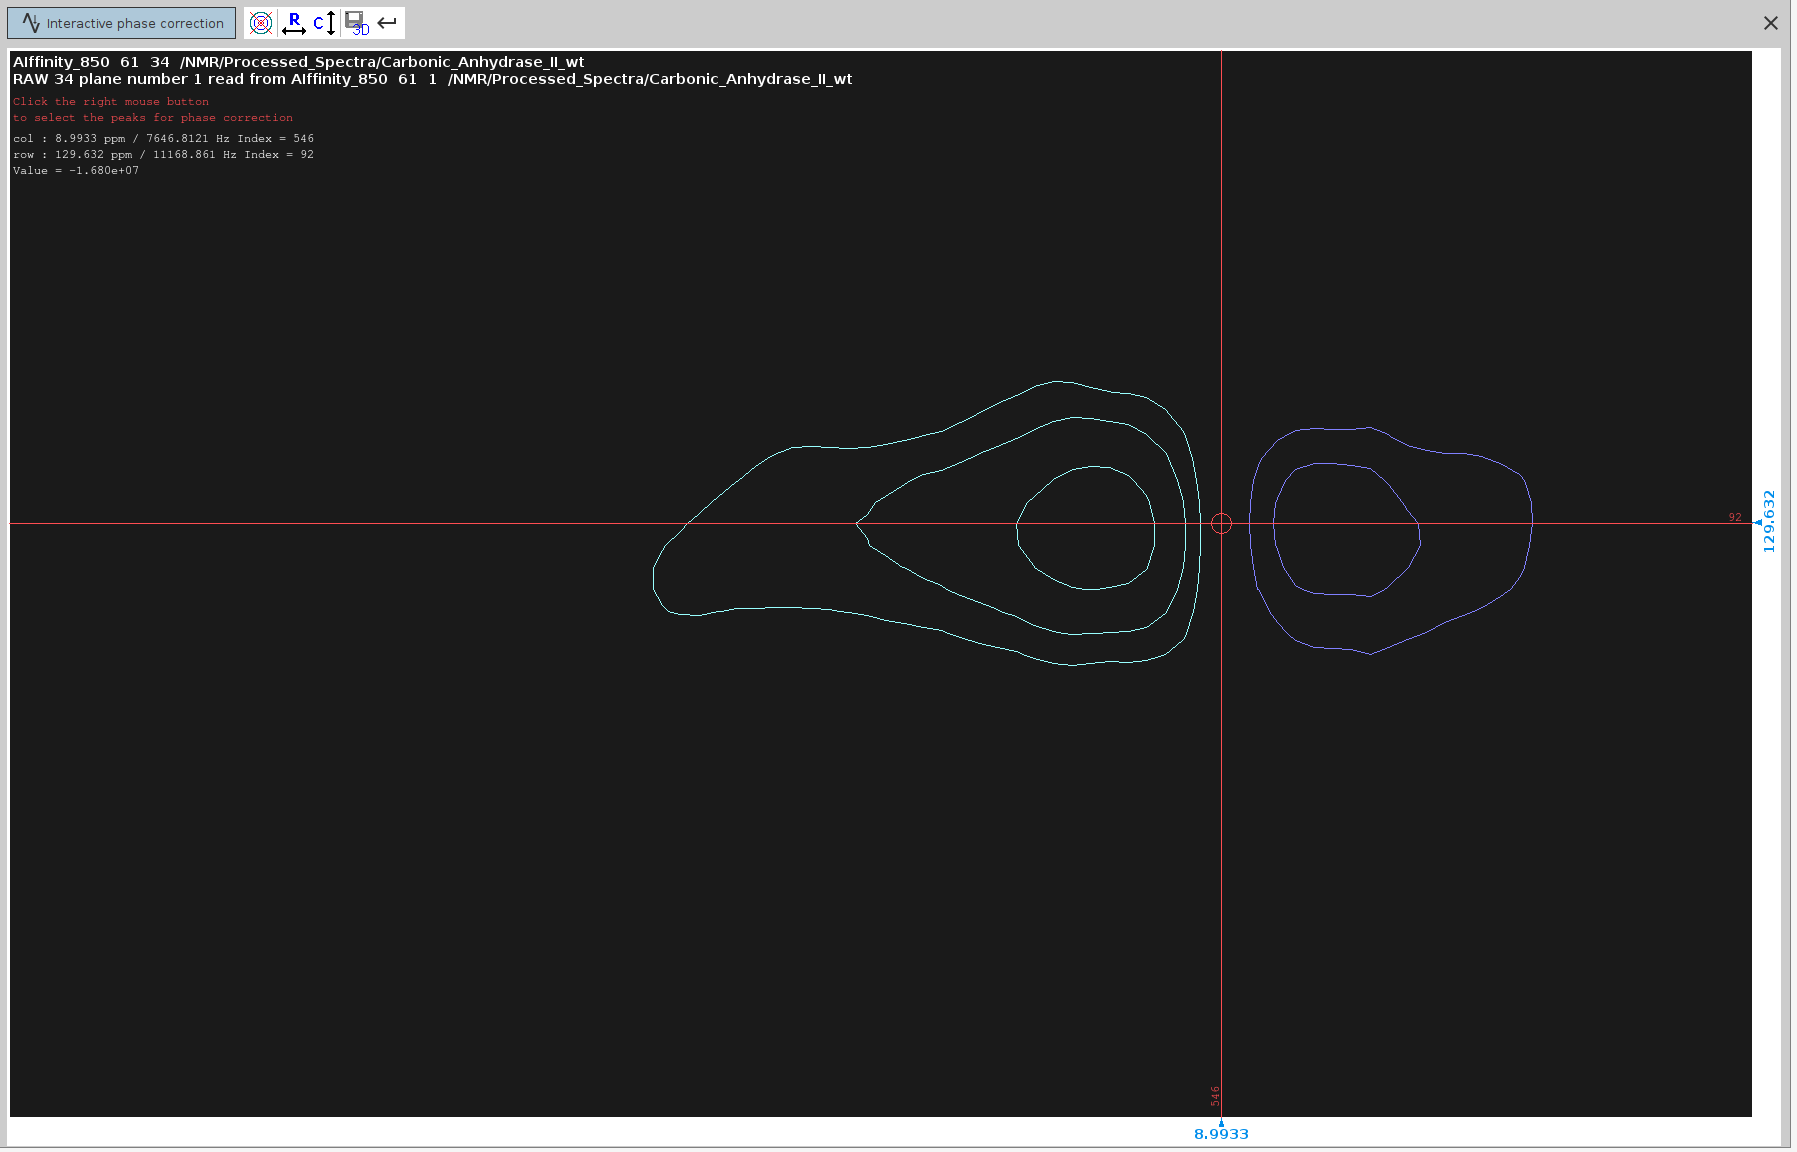
- Try to select peaks that cover the span of the whole spectrum; 4 or 5 peaks should suffice.
Note: it is useful to note the approximate F2 chemical shifts and index of the selected peaks. Knowing the frequency of the target peaks will help distinguishing them from the slices of other, non-target, peaks which may also appear in the 1D traces. The index along th F2 axis will also help you distinguish the severely misphased peaks from those that are slightly misphased.
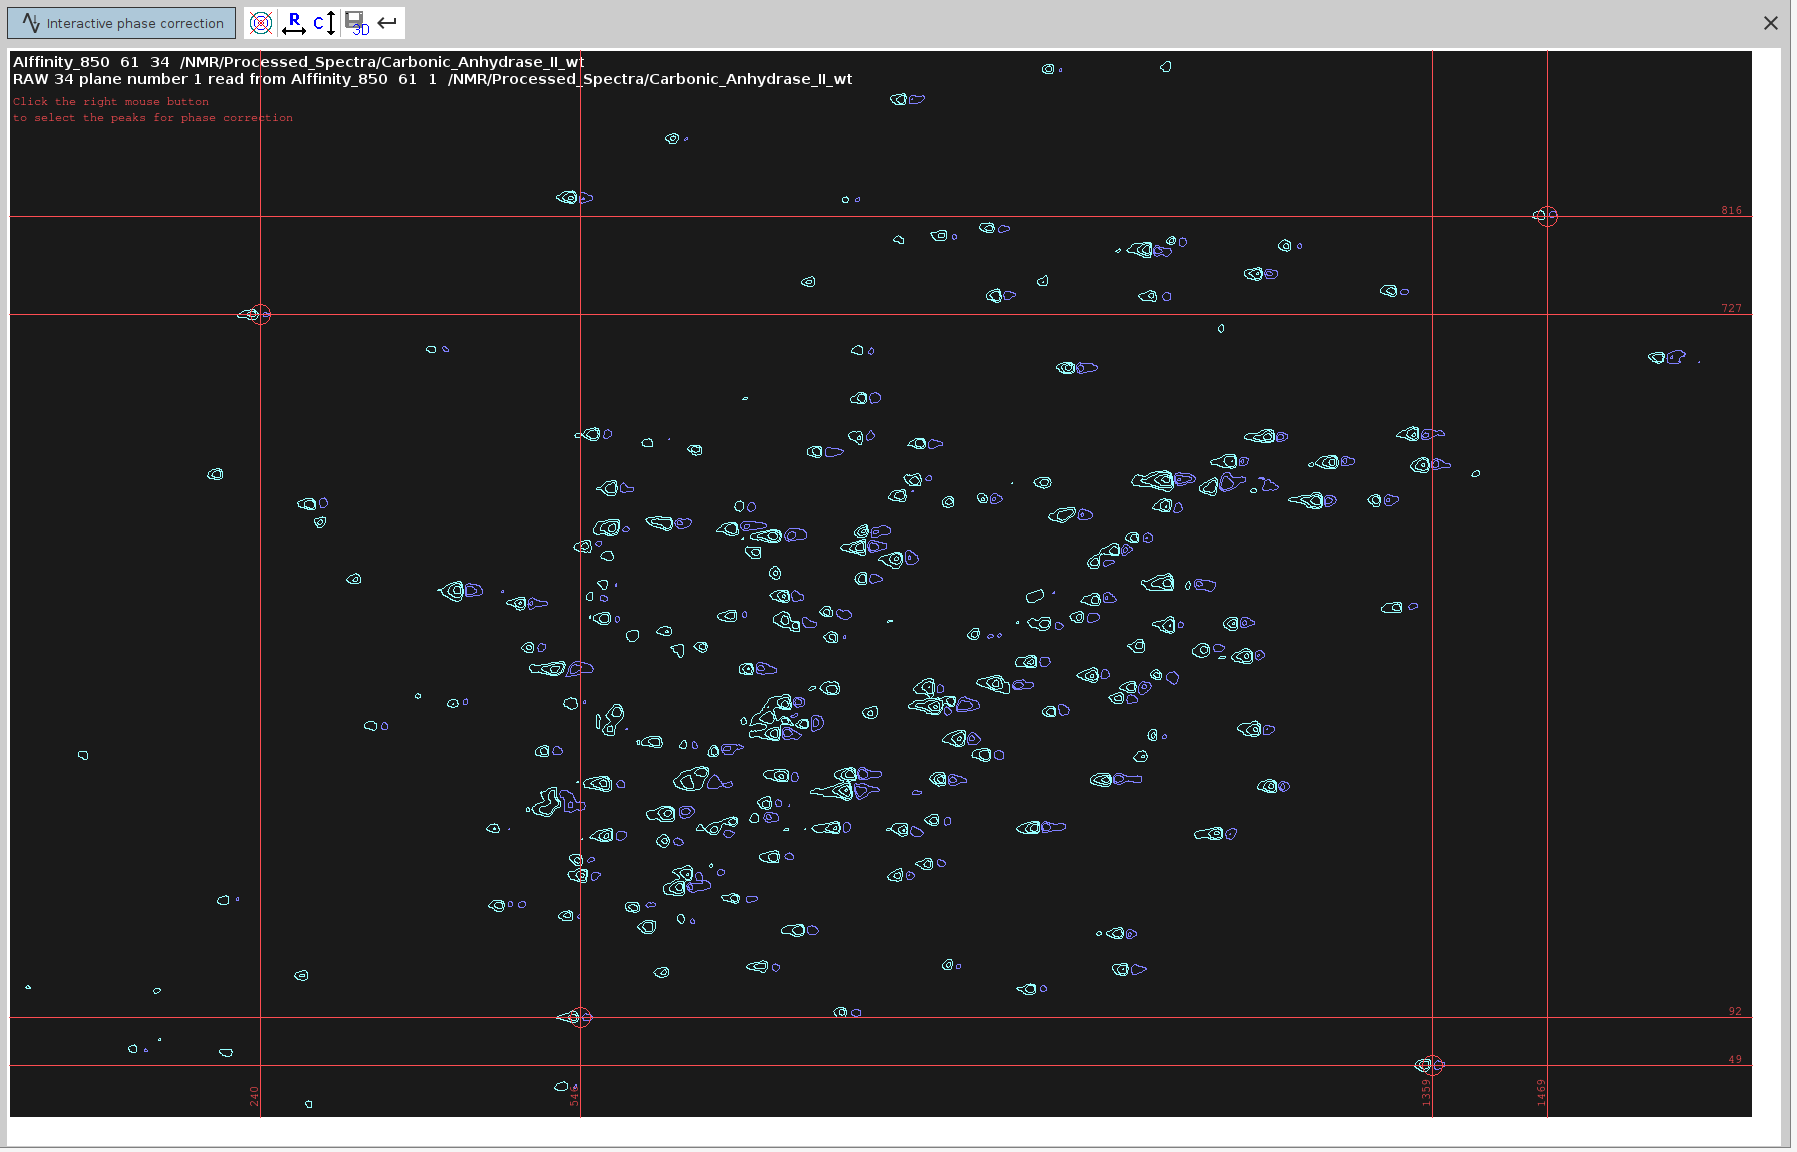
- Enter Phase Correction Mode:
- Click on the icon with the letter “R” to enter phase correction mode for the rows, which correspond to the F2 dimension.
- Set the Pivot Point:
- Right-click at the left limit of the screen and select “Set Pivot”.
- Place the pivot point away from the peaks to avoid hiding the frequencies we want to phase.
- Note: Only the
PHC0value will be adjusted, notPHC1, so a pivot line is not necessary.
- Adjust the Phase:
- Left-button press on the “0” icon and drag your mouse until the strongest signals appear at the top part of each panel.
- Ensure the frequency lines from end to end look straight and balanced.
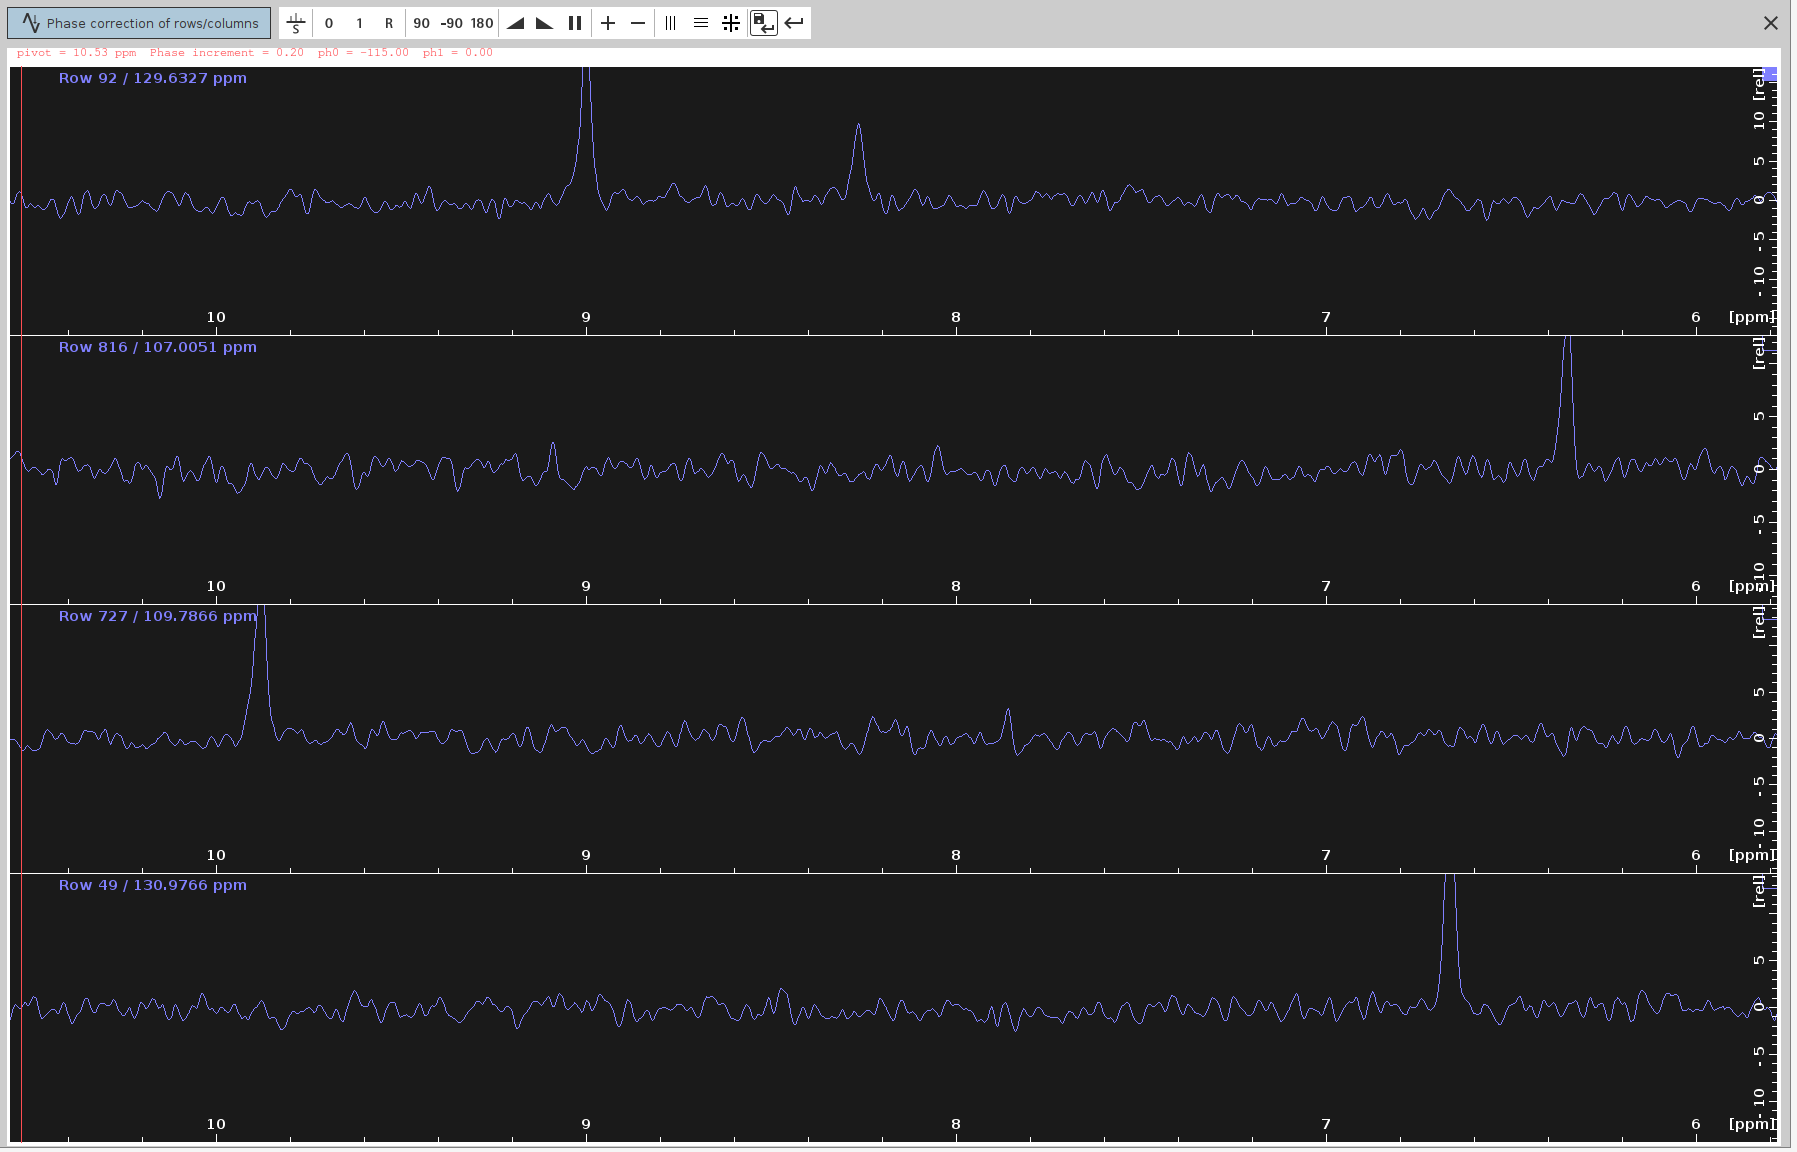
- Save the PHC0 Value:
- Click on the “Save-disk” icon to save the selected
PHC0value (e.g.,-115degrees) to the N-HN plane spectrum. - Then click the Return icon.
- Click on the “Save-disk” icon to save the selected
- Verify the Phase-Corrected Spectrum:
- The phase-corrected spectrum should now appear without any anti-phase peak components.
- Save and Apply PHC0:
- Note down the optimal
PHC0value (e.g.,-115.0degrees) and click the Save-disk nD icon to copy the values to the 2D plane. Then click the Return icon. - Transfer the phasing coefficients
PHC0and, if used,PHC1to the raw 4D (unprocessed) spectrum
- Note down the optimal
- Next Steps:
- You are now ready for concomitant NUS-reconstruction and phase correction as described in the NUS-reconstruction tutorials.
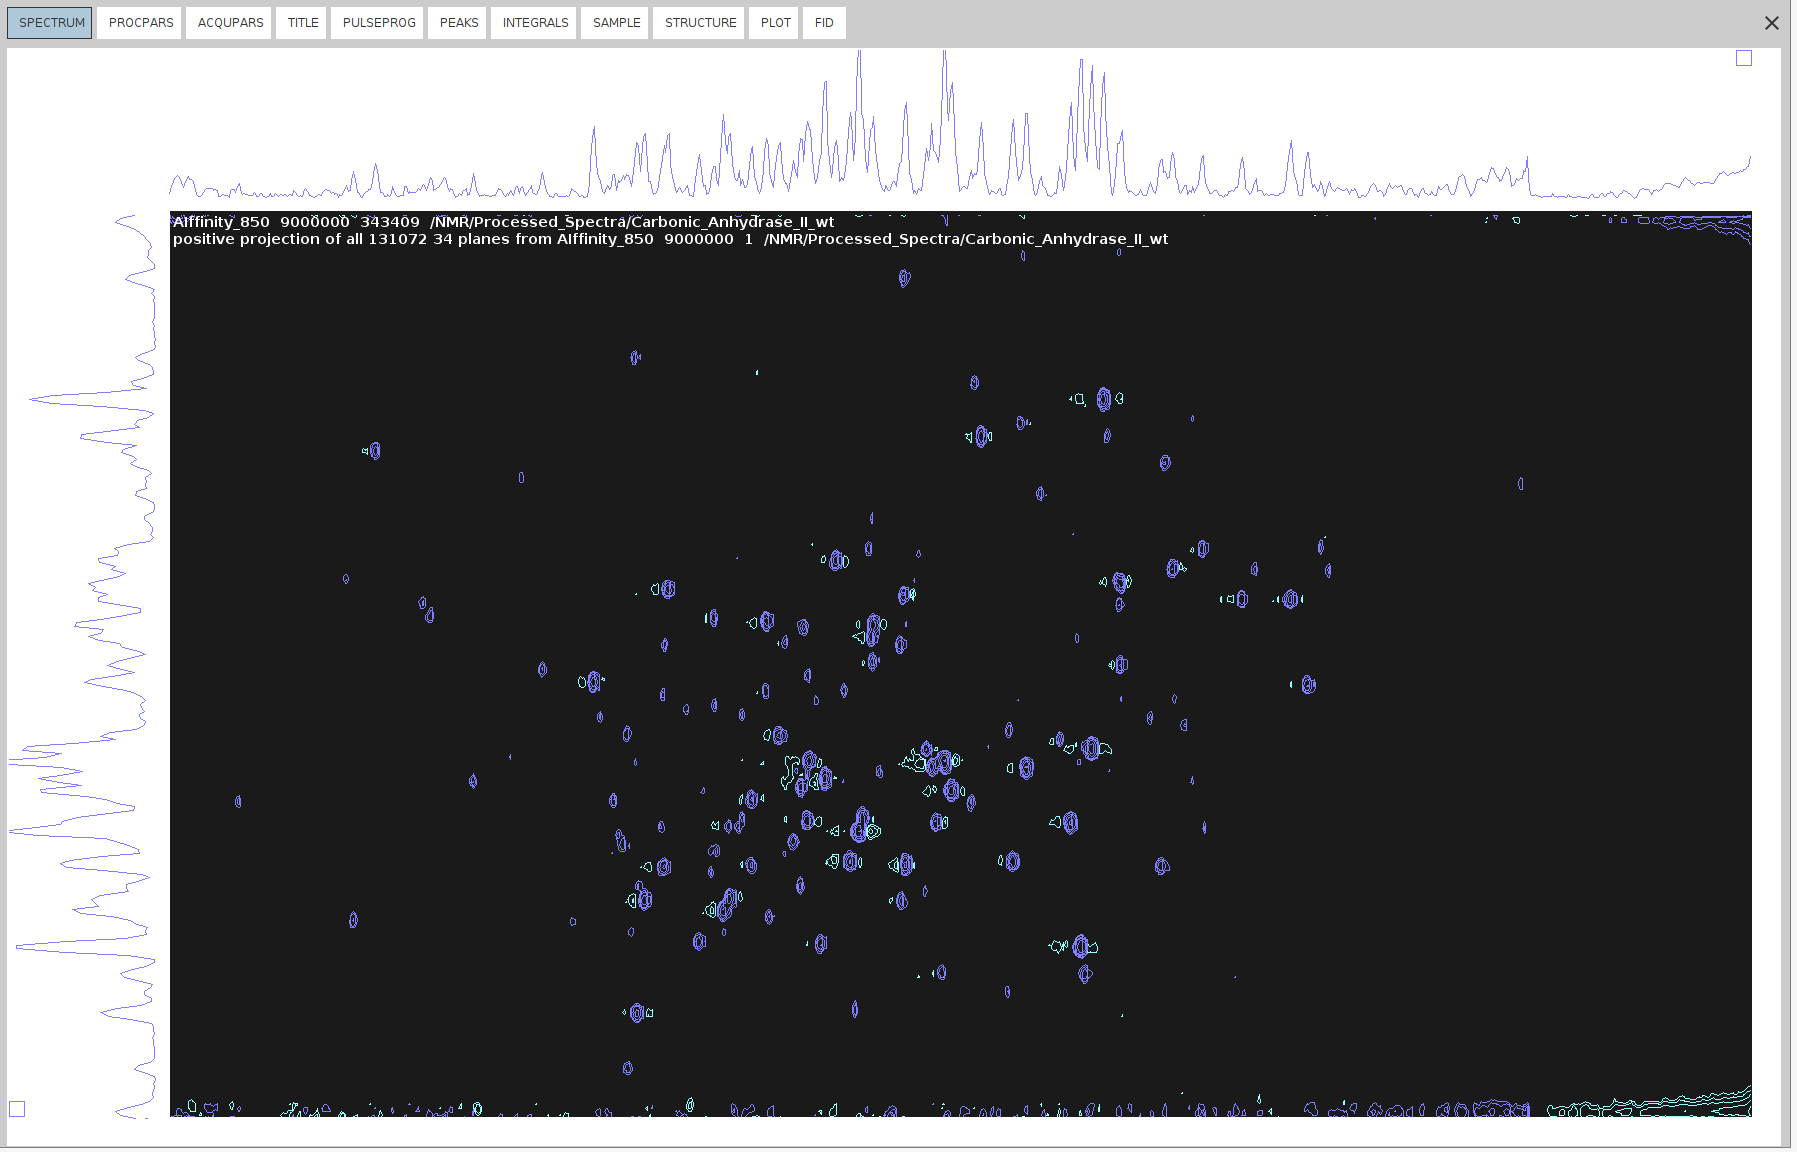
SOLUTION 3: Phase-Correct the F3-F4 sum projection of the 4D Spectrum.
Example Data: Raw_Spectra/Carbonic_Anhydrase_2/hCA2-wt_850/9
- Spectrum processing without NUS reconstruction:
- Reset all phase values to
0as described in SOLUTION 1, step 1, unless you:
- used sfhmqc_noe_sfhmqc_4Dhcnh.fl pulse program (see NUS-reconstruction tutorials)
- you have already found a
F4(PHC0)value using SOLUTION 1, and now you want to optimize it further with this SOLUTION. - Typically, you should perform NUS reconstruction of the 4D spectrum using theftnd 0command. However, this process can take anywhere from 3 to 12 hours, which may not always be practical. In some cases, you might choose to skip the full NUS reconstruction. By running the commandftnd 0 nusft, you can process the full spectrum-including fid baseline correction, window multiplication, Fourier transform, and phase correction—without reconstructing the missing data points. Use this option at your own discretion. While this method is faster than a full NUS reconstruction, it still requires time and may result in a lower-quality spectrum. This is especially true for 4D spectra, which typically use lowNusAMOUNTvalues (less than 3%). If you find the quality insufficient for the next steps, you can reprocess the 4D spectrum using the fullftnd 0command.
- Reset all phase values to
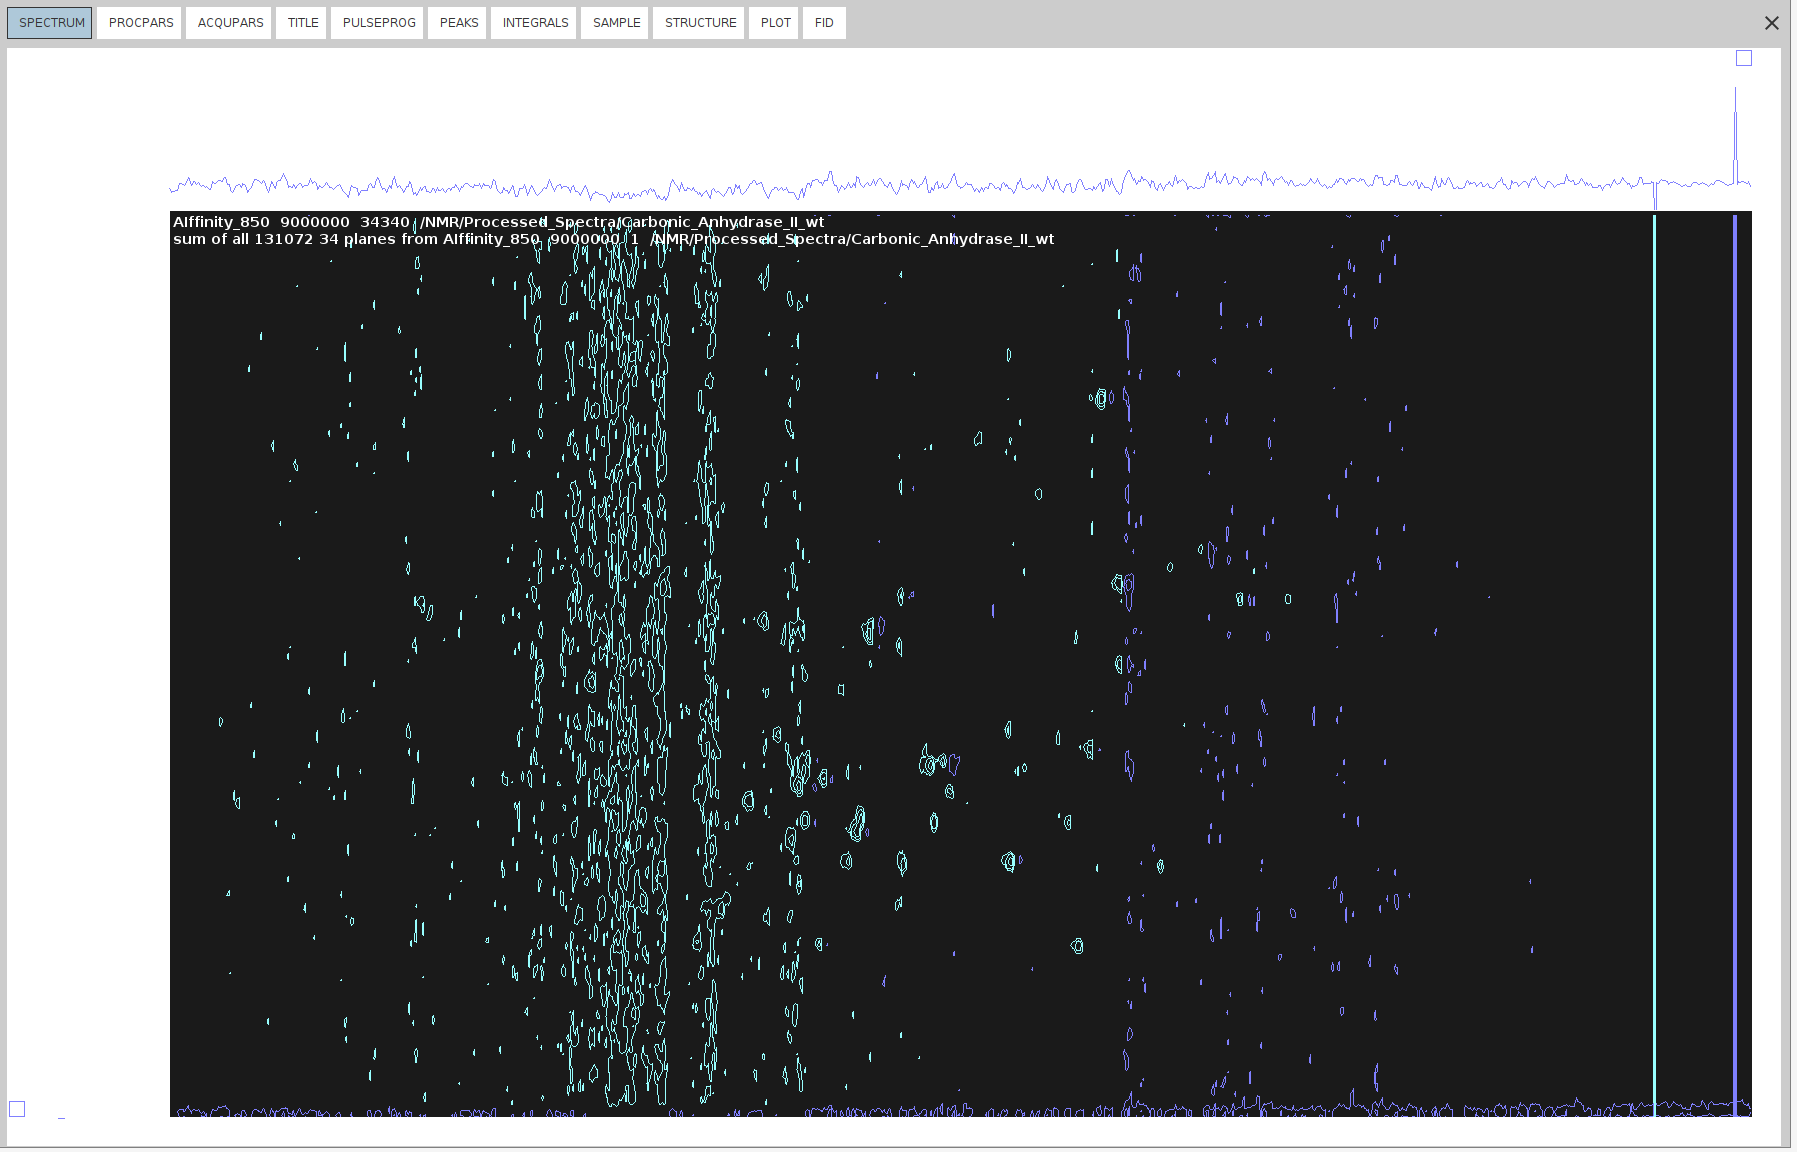
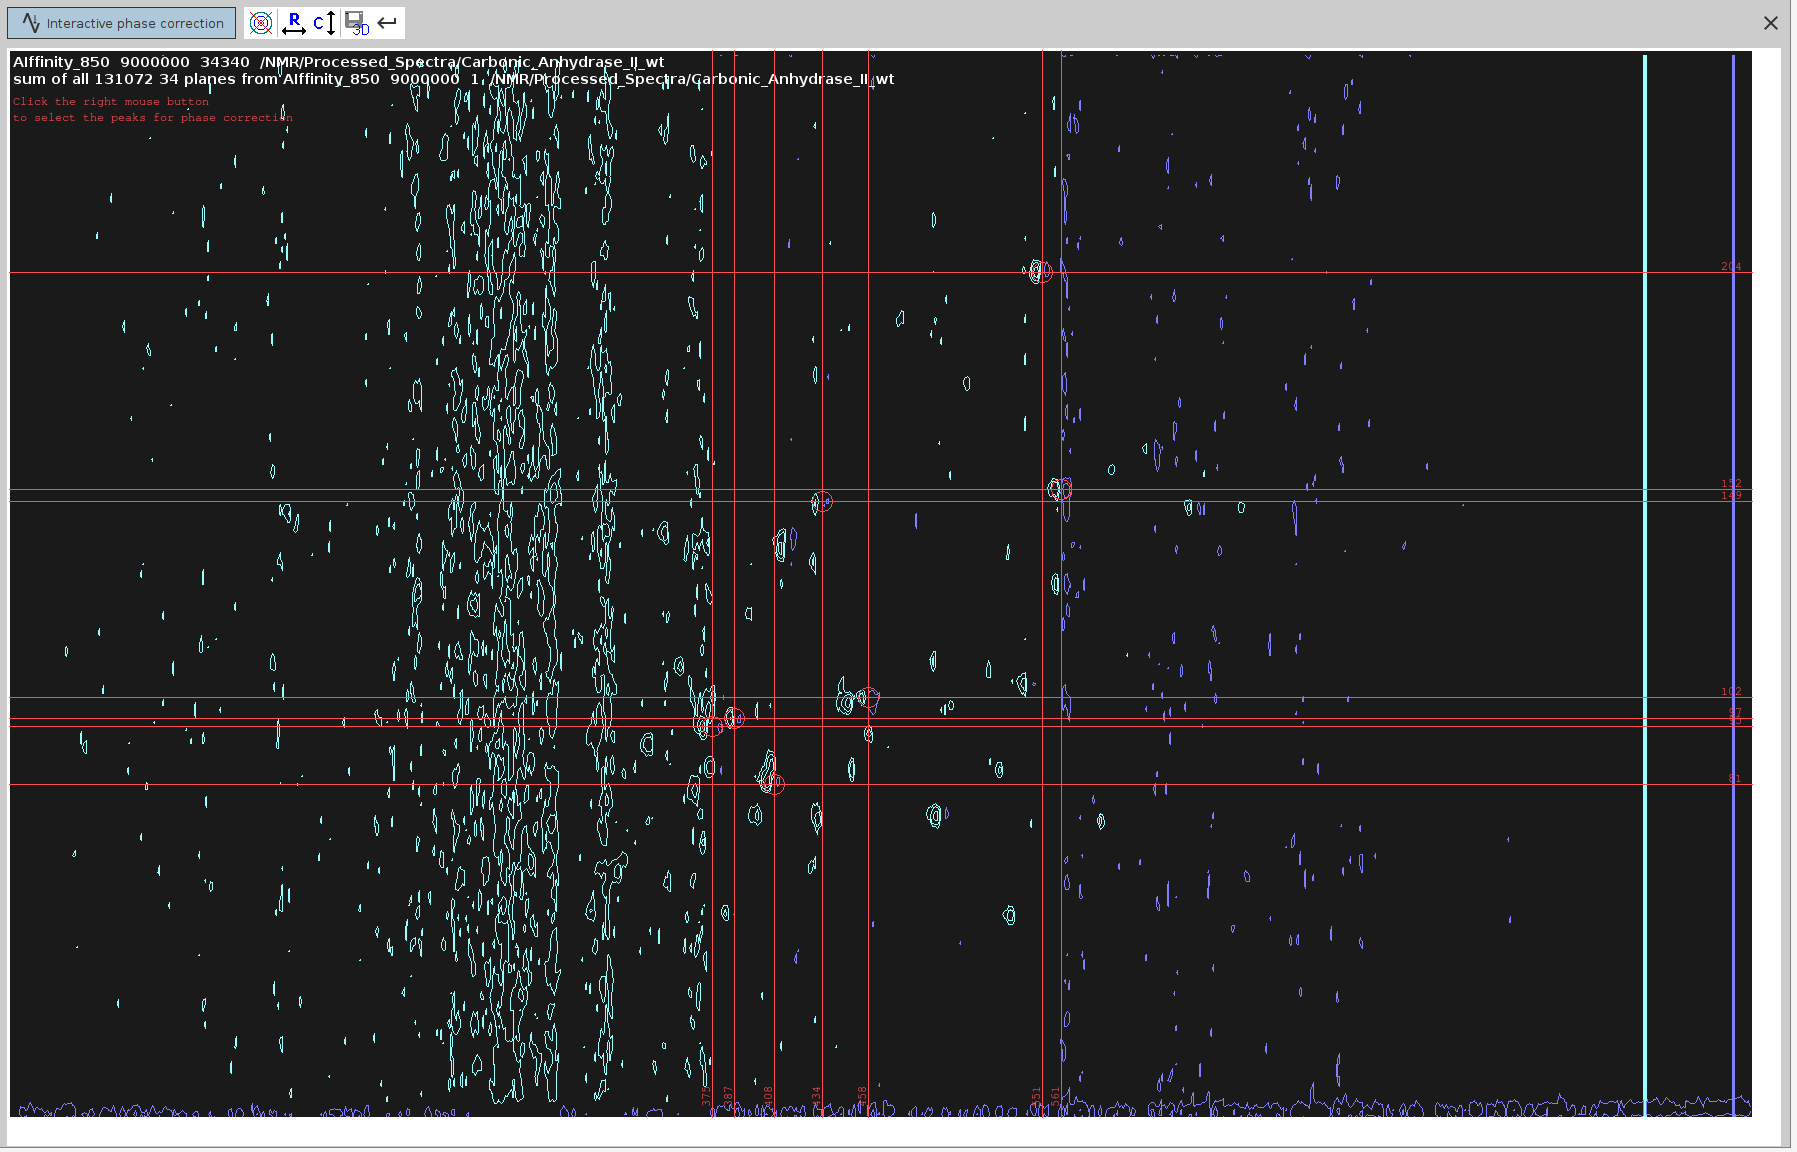
- Extract Sum Projection:
- Use the command
sumpl 34 all all 34340to extract the sum 34 projection, which is the sum of positive and negative 34 projections. It looks quite noisy with dominant negative signals, and barely resembles the 34 plane that we phased in SOLUTION 2. But that’s OK.
- Use the command
- Create Imaginary Dimensions:
- Run
xht1andxht2on the 34 sum projection to create the imaginary dimensions.
- Run
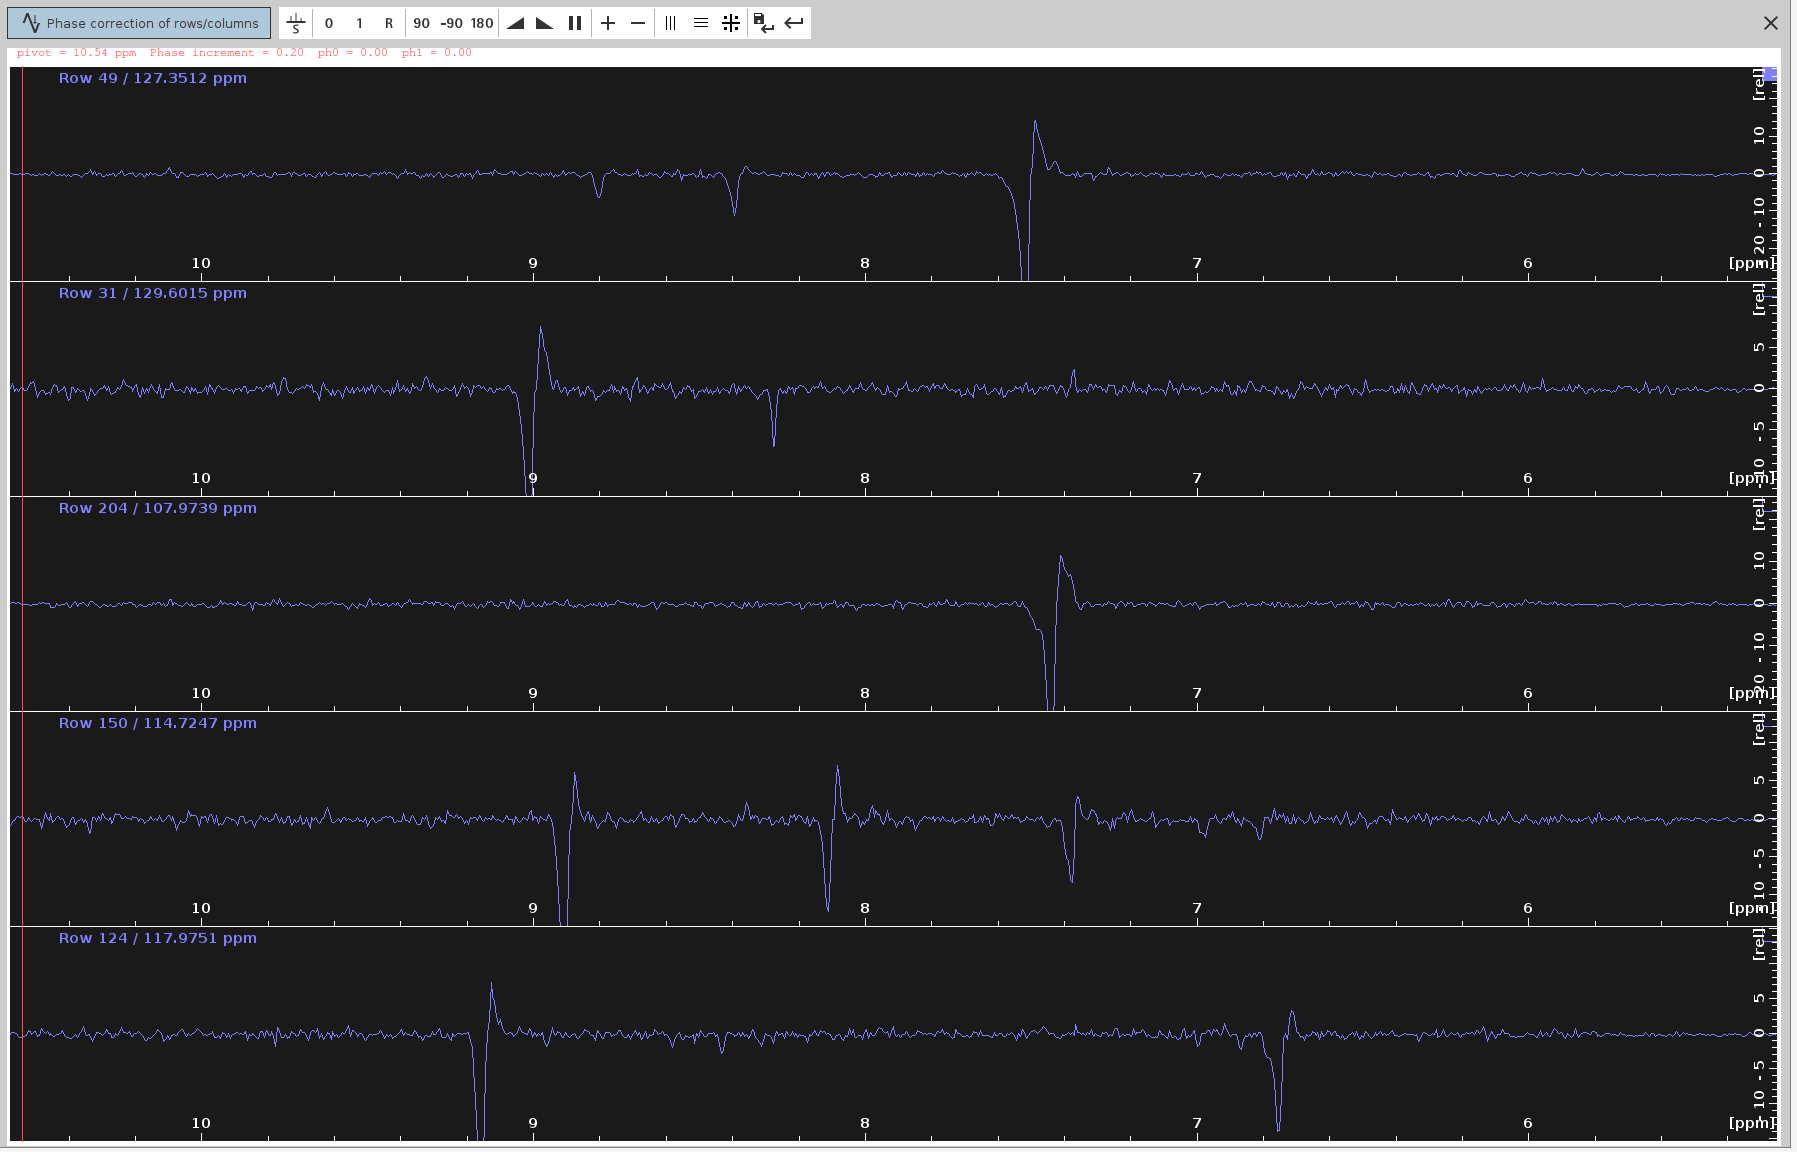
- Manual Phase Correction:
- Our aim is to suppress the negative signals as much as possible. For some types of spectra this doesn’t imply that they are correctly phased, but for 4D HCNH NOESY it does.
- Run
.phfor manual phase correction and phase correct only on F4, as described in SOLUTION 2, steps 3-10. The only difference here is that we are processing 2D spectrum derived from a 4D spectrum measured with NUS, and hence we cannot do zero-filling or truncate the dimensions withxfbcommand. We can only doabs2andabs1for baseline correction. - We can also manually apply different phase values (
PHC0,PHC1) in F2 using the commandxf2p. - Identify and select peaks with antiphase component that span as much of the spectrum as possible. Not many available in this one.
- Switch to phase correction mode for the rows.
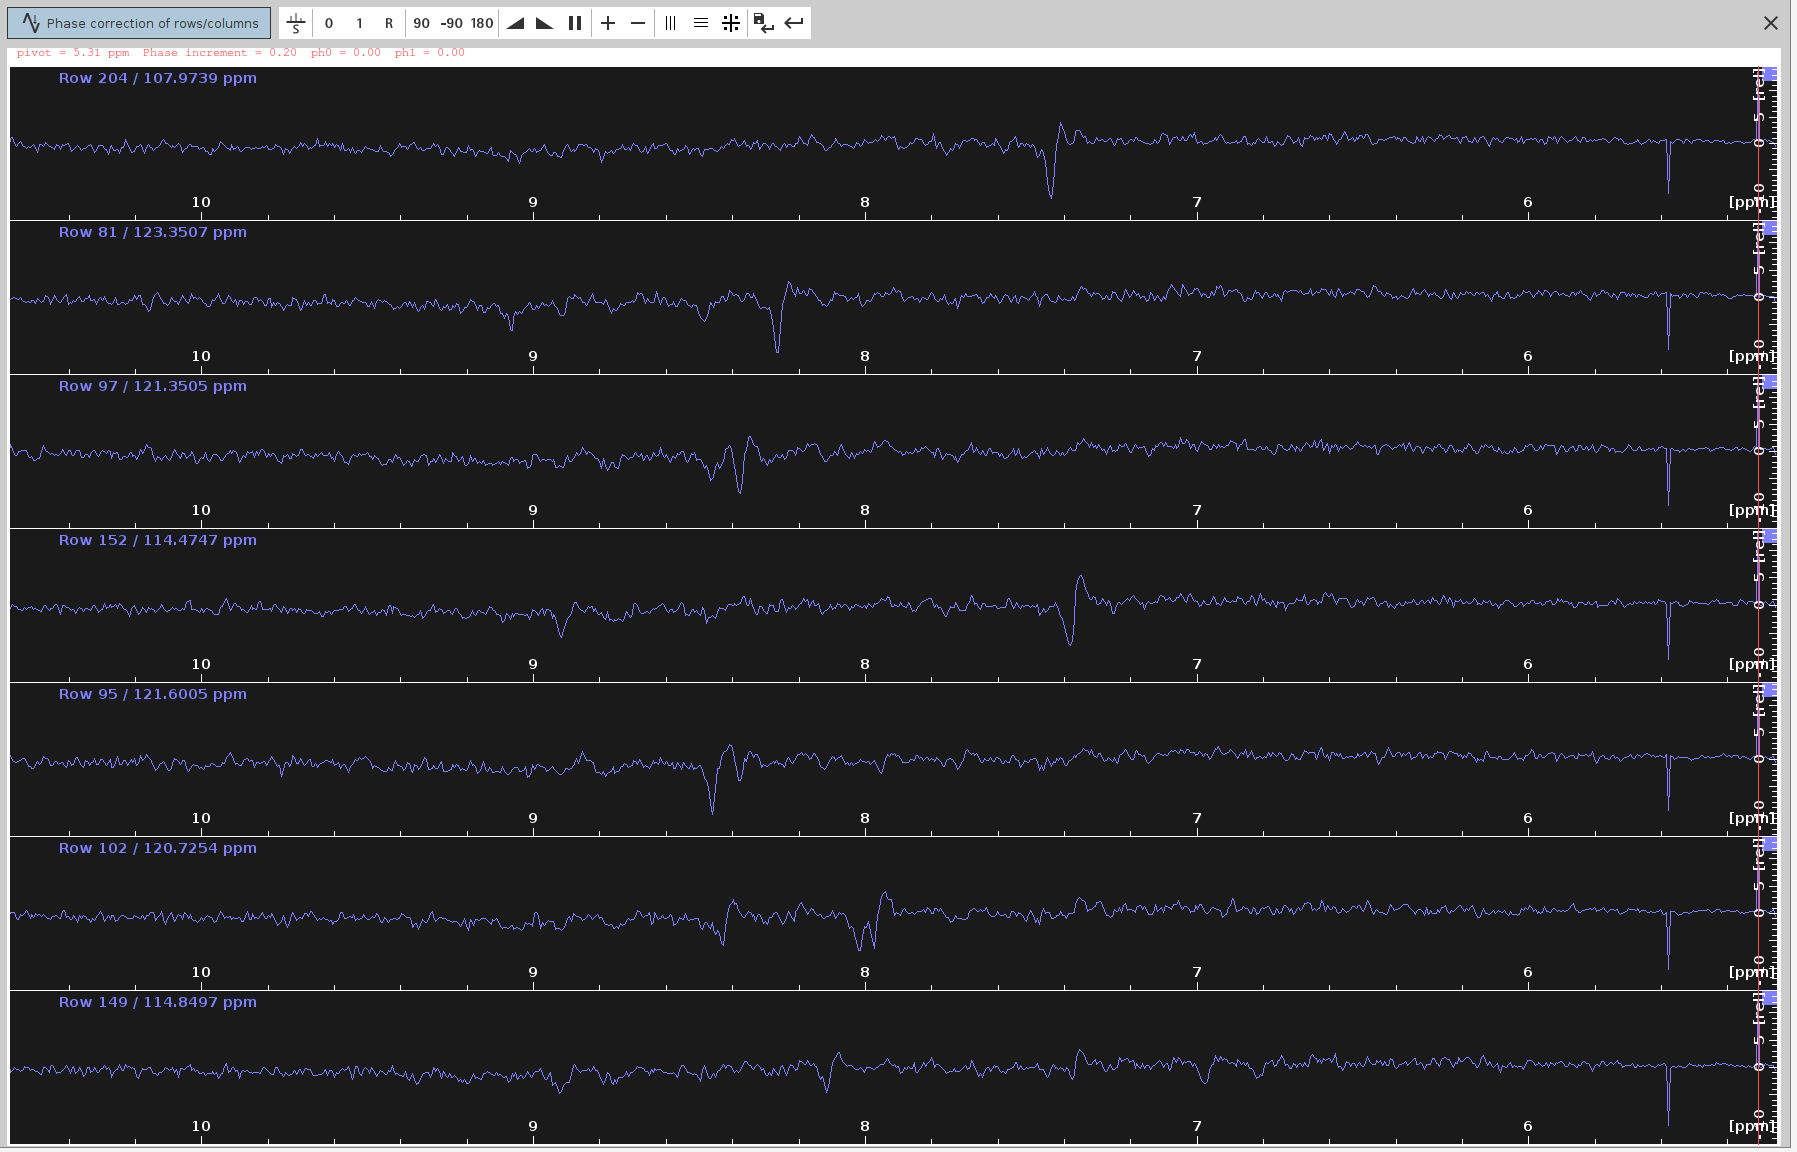
- Adjust the
ph0angle to make the strongest signals point upwards and the frequency lines from end to end to appear as straight as possible. The optimalph0angle is around-115degrees, which is in agreement with SOLUTION 1 and 2.
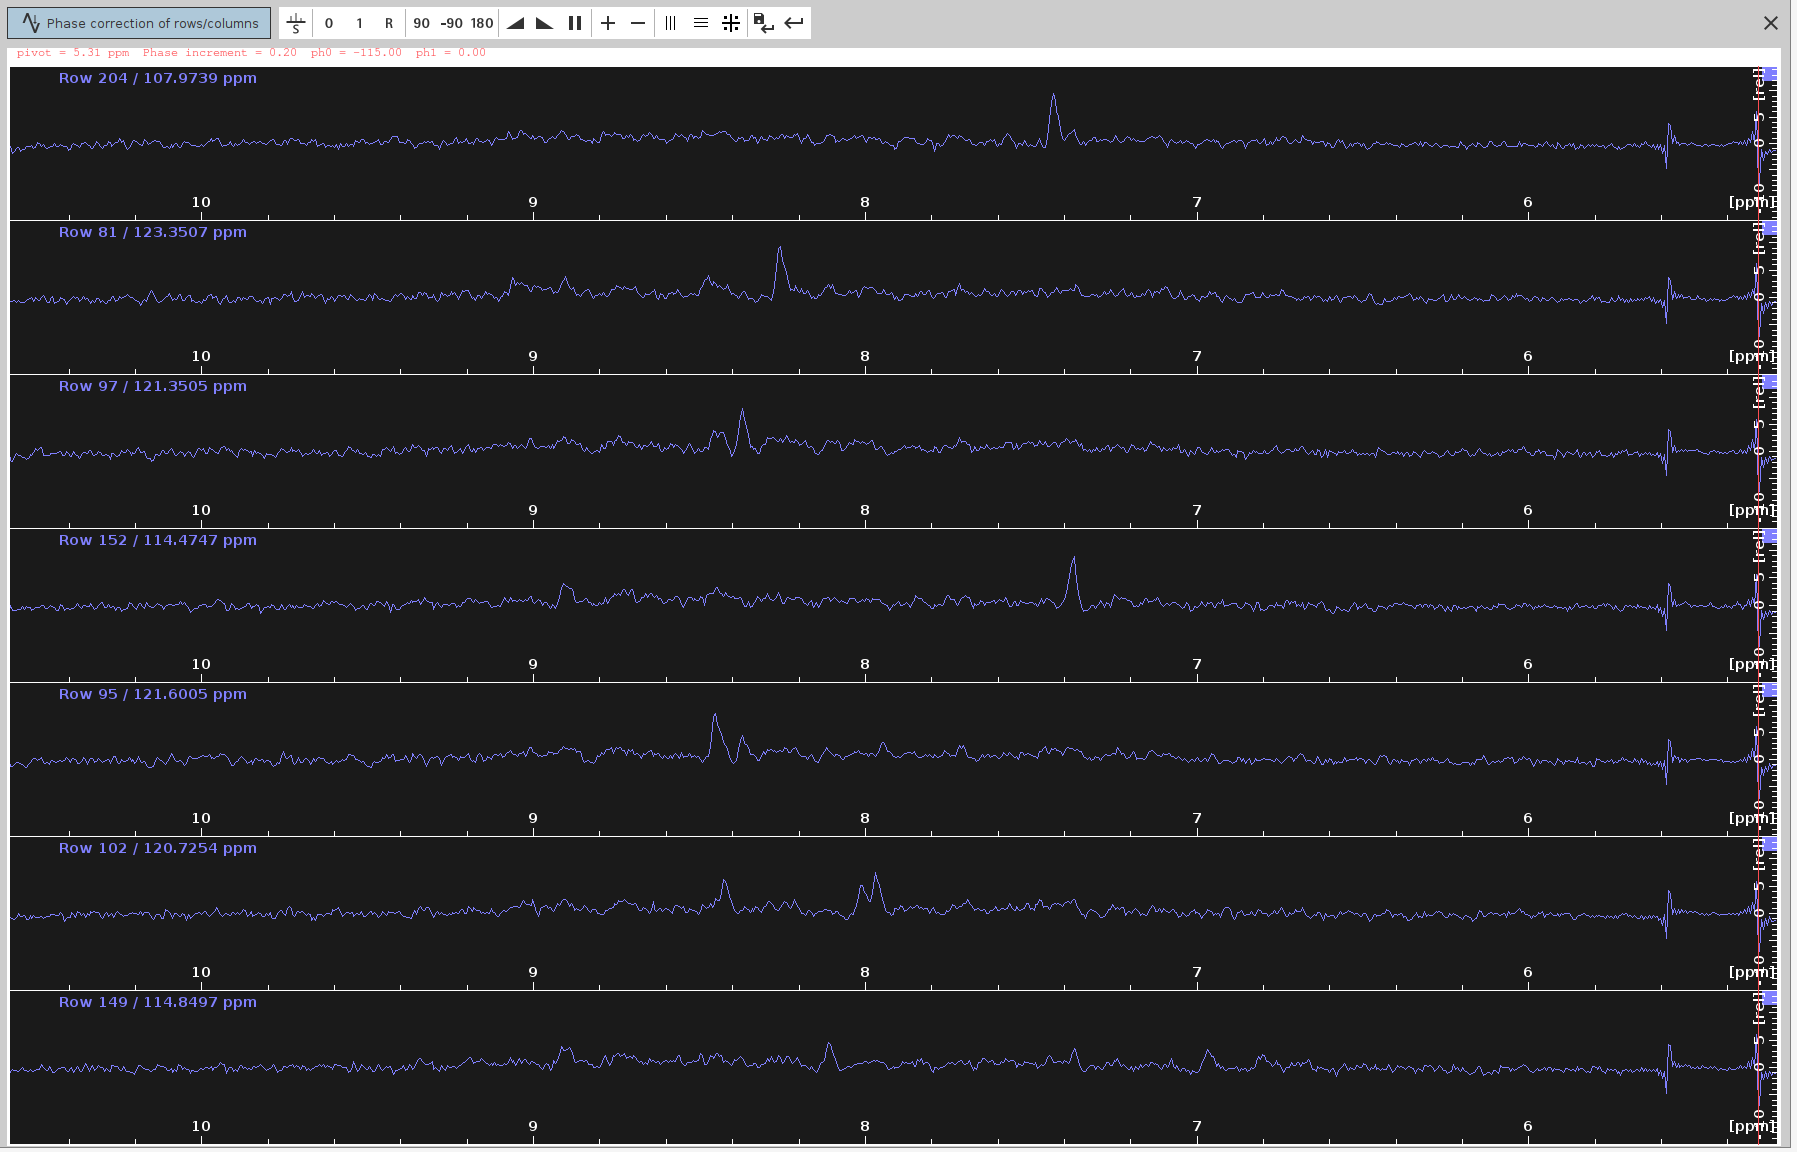
- The negative signals have been almost eliminated and the positive now appear stronger.
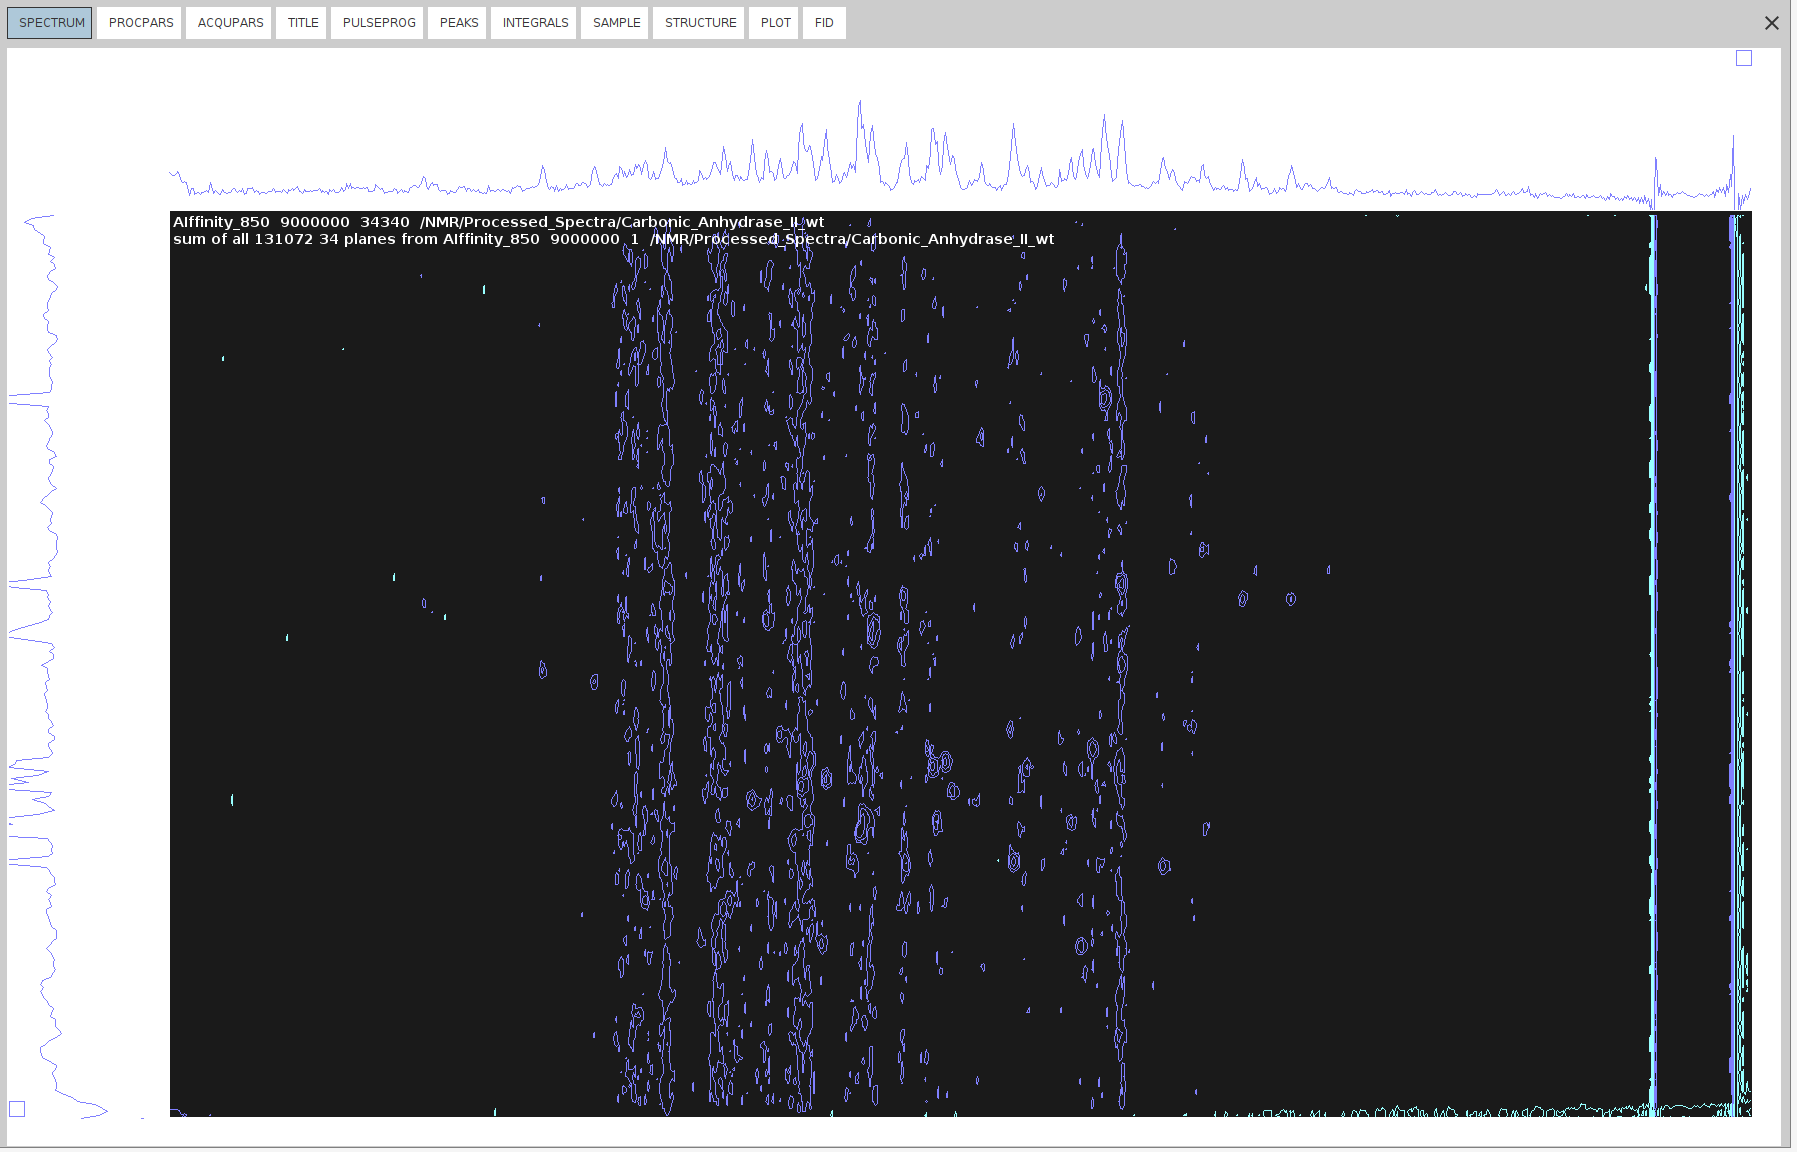
- Apply Phase Correction to 4D:
- Copy the
F4(PHC0)value to the 4D spectrum. - Execute
pknd 4(WARNING: very slow!; may be faster to redoftnd 0orftnd 4)
- Copy the
SOLUTION 4: Phase-Correct the F3-F4 projections’ sum of the 4D Spectrum.
Warning: This solution is not the most accurate one. Is otherwise identical to SOLUTION 3, but instead of creating the sum projection, we create the positive and negative projections, and then we sum them.
Example Data: Raw_Spectra/Carbonic_Anhydrase_2/hCA2-wt_850/9
- Spectrum processing without NUS reconstruction:
- Reset all F4 phase values to
0as described in SOLUTION 1, step 1. - Initiate raw spectrum processing with zero phase values as described in SOLUTION 1, step 2.
- Reset all F4 phase values to
- Extract Projections:
- Use the command
projplp 34 all all 34to extract the positive 34 projection.
- Use the command
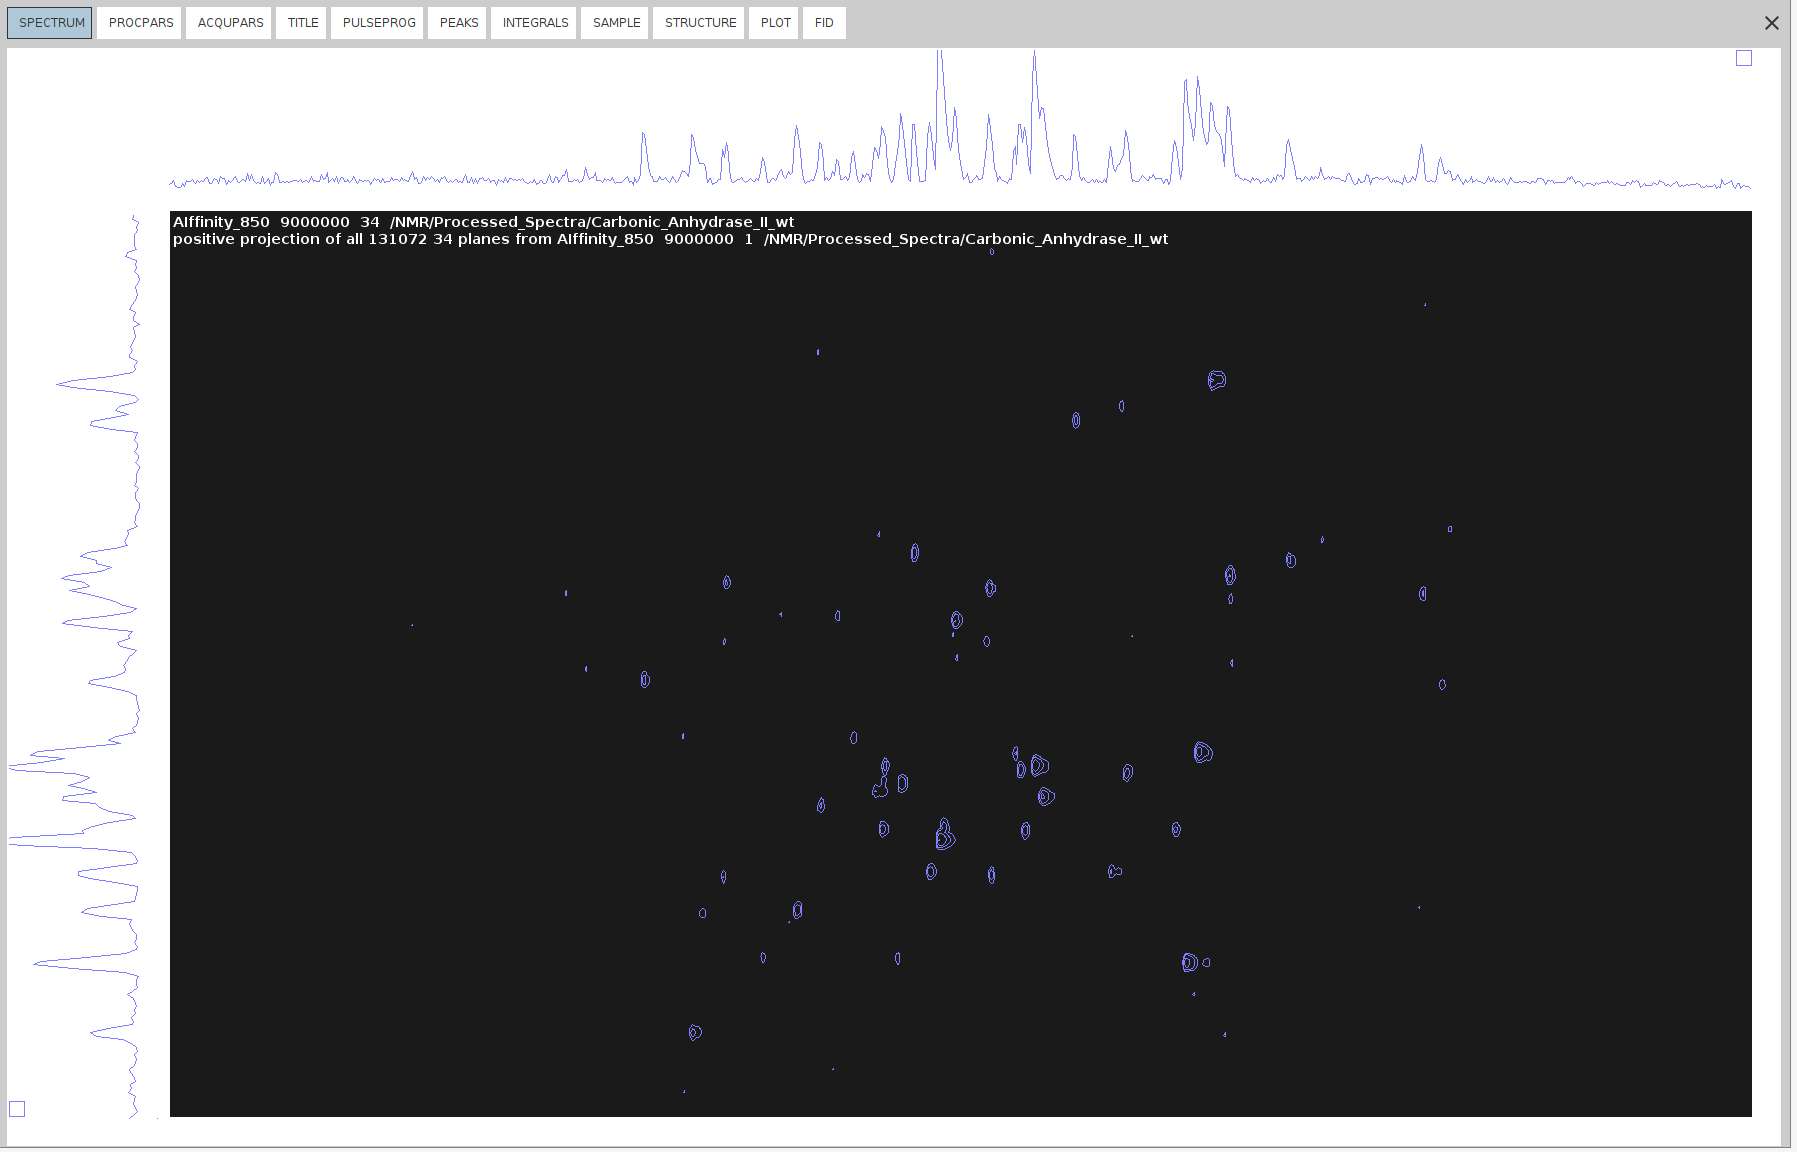
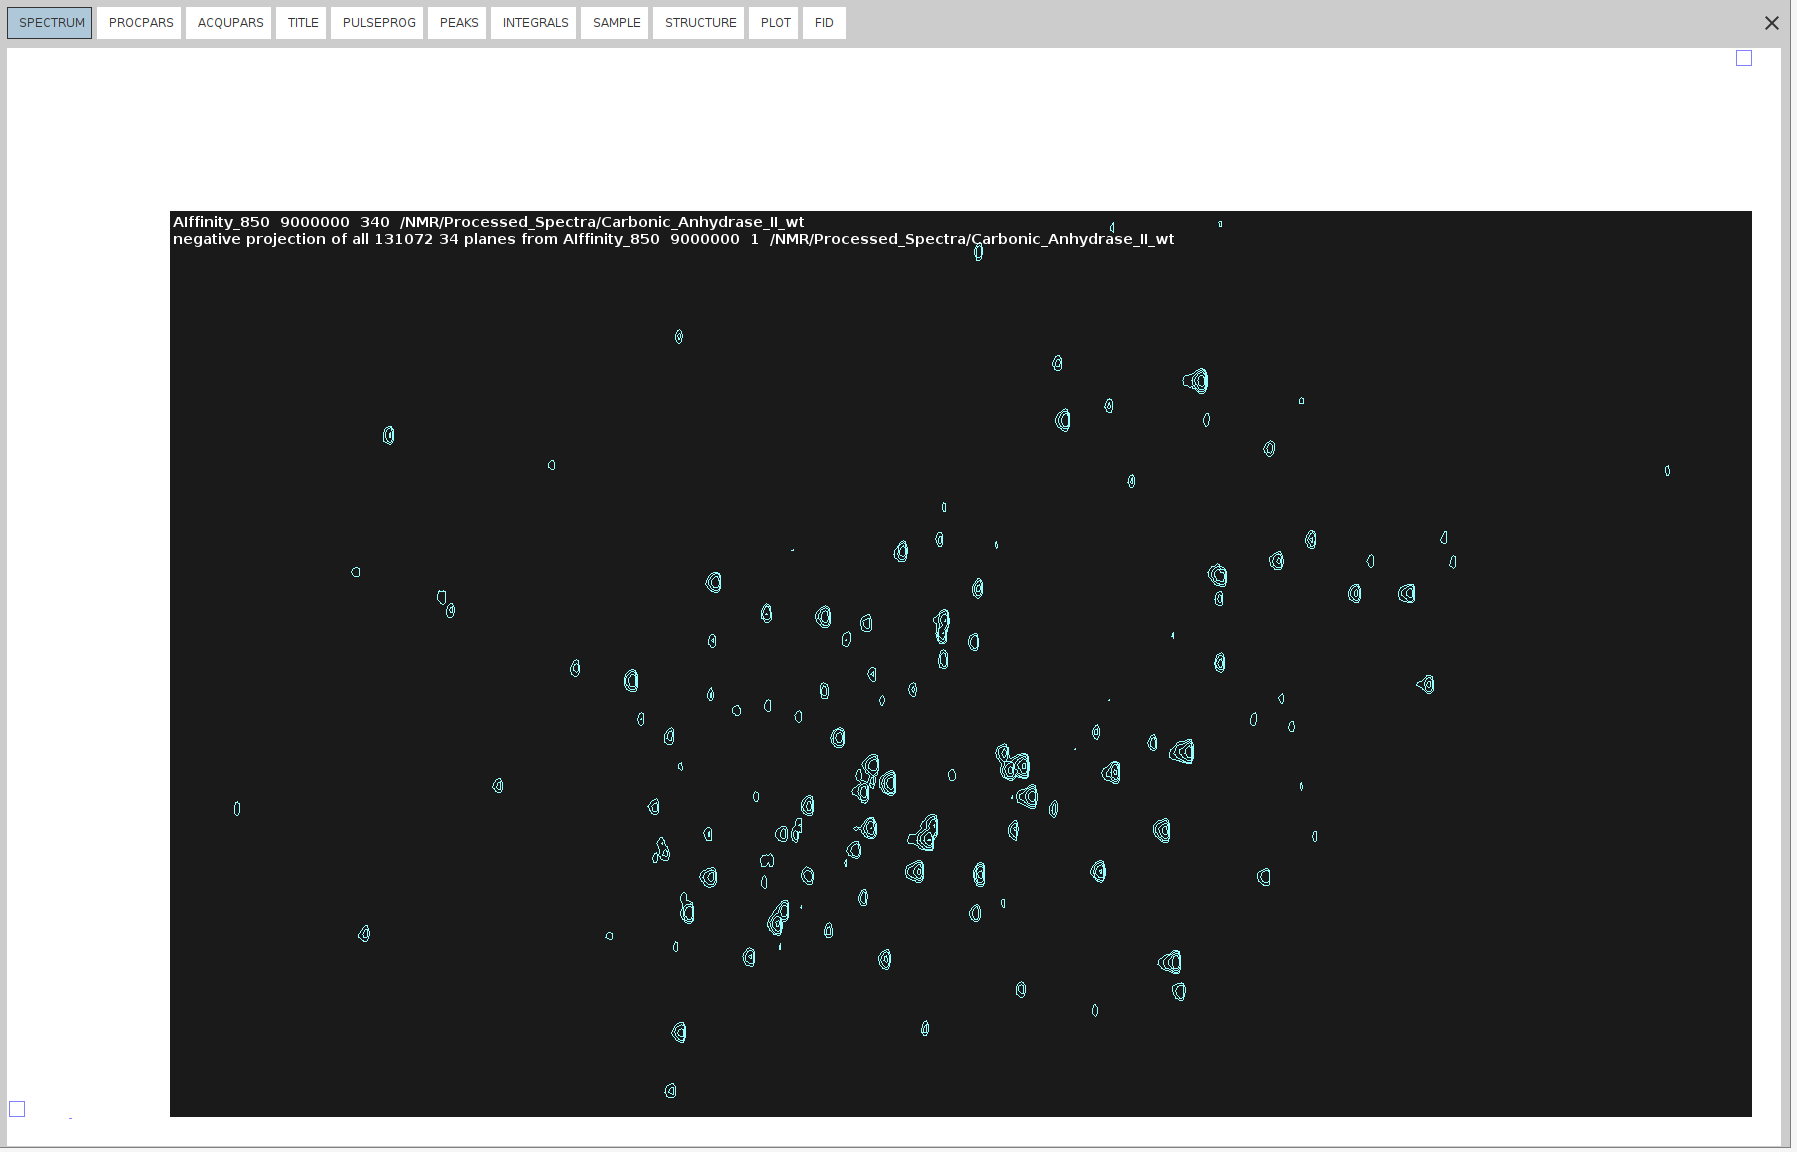
- Use the command
projpln 34 all all 340for the negative 34 projection.
- Create Imaginary Dimensions:
- Run
xht1andxht2on the 34 projections to create the imaginary dimensions.
- Run
- Sum Positive and Negative Projection
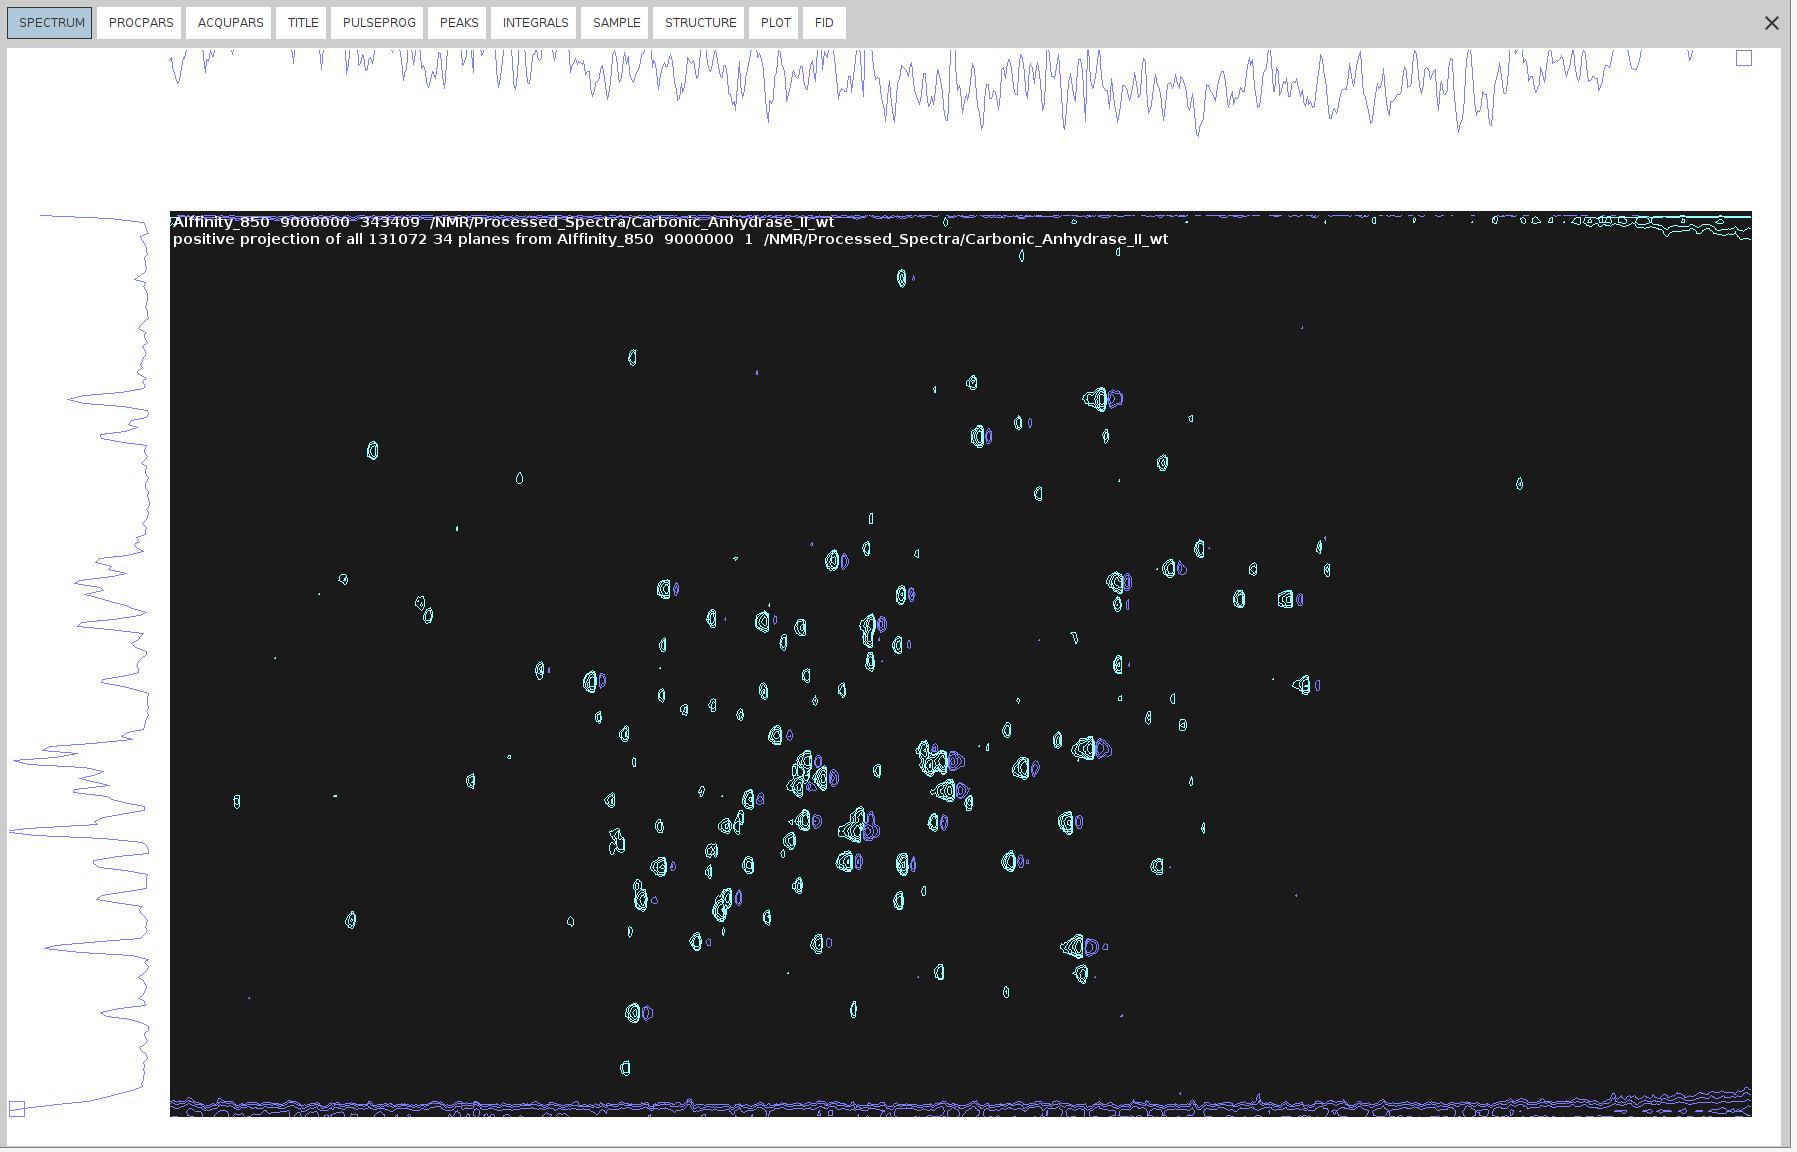
- Open
34and typewrpto copy it to a new file named343409. - Run
adsu, and from the new menu bar, go to Add -> Change constant ALPHA and set it to1. - Then, go to Add -> Change constant GAMMA and set it to
1. - Select Define 2nd Dataset and type the name of the negative projection (
340). - Execute the
add2dcommand to add the negative projection (340) to the copy of the positive (34340).
- Open
- Run
xht1andxht2on the 34 projections to create the imaginary dimensions. - Now you can phase it.
- Manual Phase Correction:
- Our aim is to suppress the negative signals as much as possible. For some types of spectra this doesn’t imply that they are correctly phased, but for 4D HCNH NOESY it does.
- Run
.phfor manual phase correction and phase correct only on F4, as described in SOLUTION 2, steps 3-10. The only difference here is that we are processing 2D spectrum derived from a 4D spectrum measured with NUS, and hence we cannot do zero-filling or truncate the dimensions withxfbcommand. We can only doabs2andabs1for baseline correction. - We can also manually apply different phase values (
PHC0,PHC1) in F2 using the commandxf2p. - Identify and select peaks that span the entire spectrum.
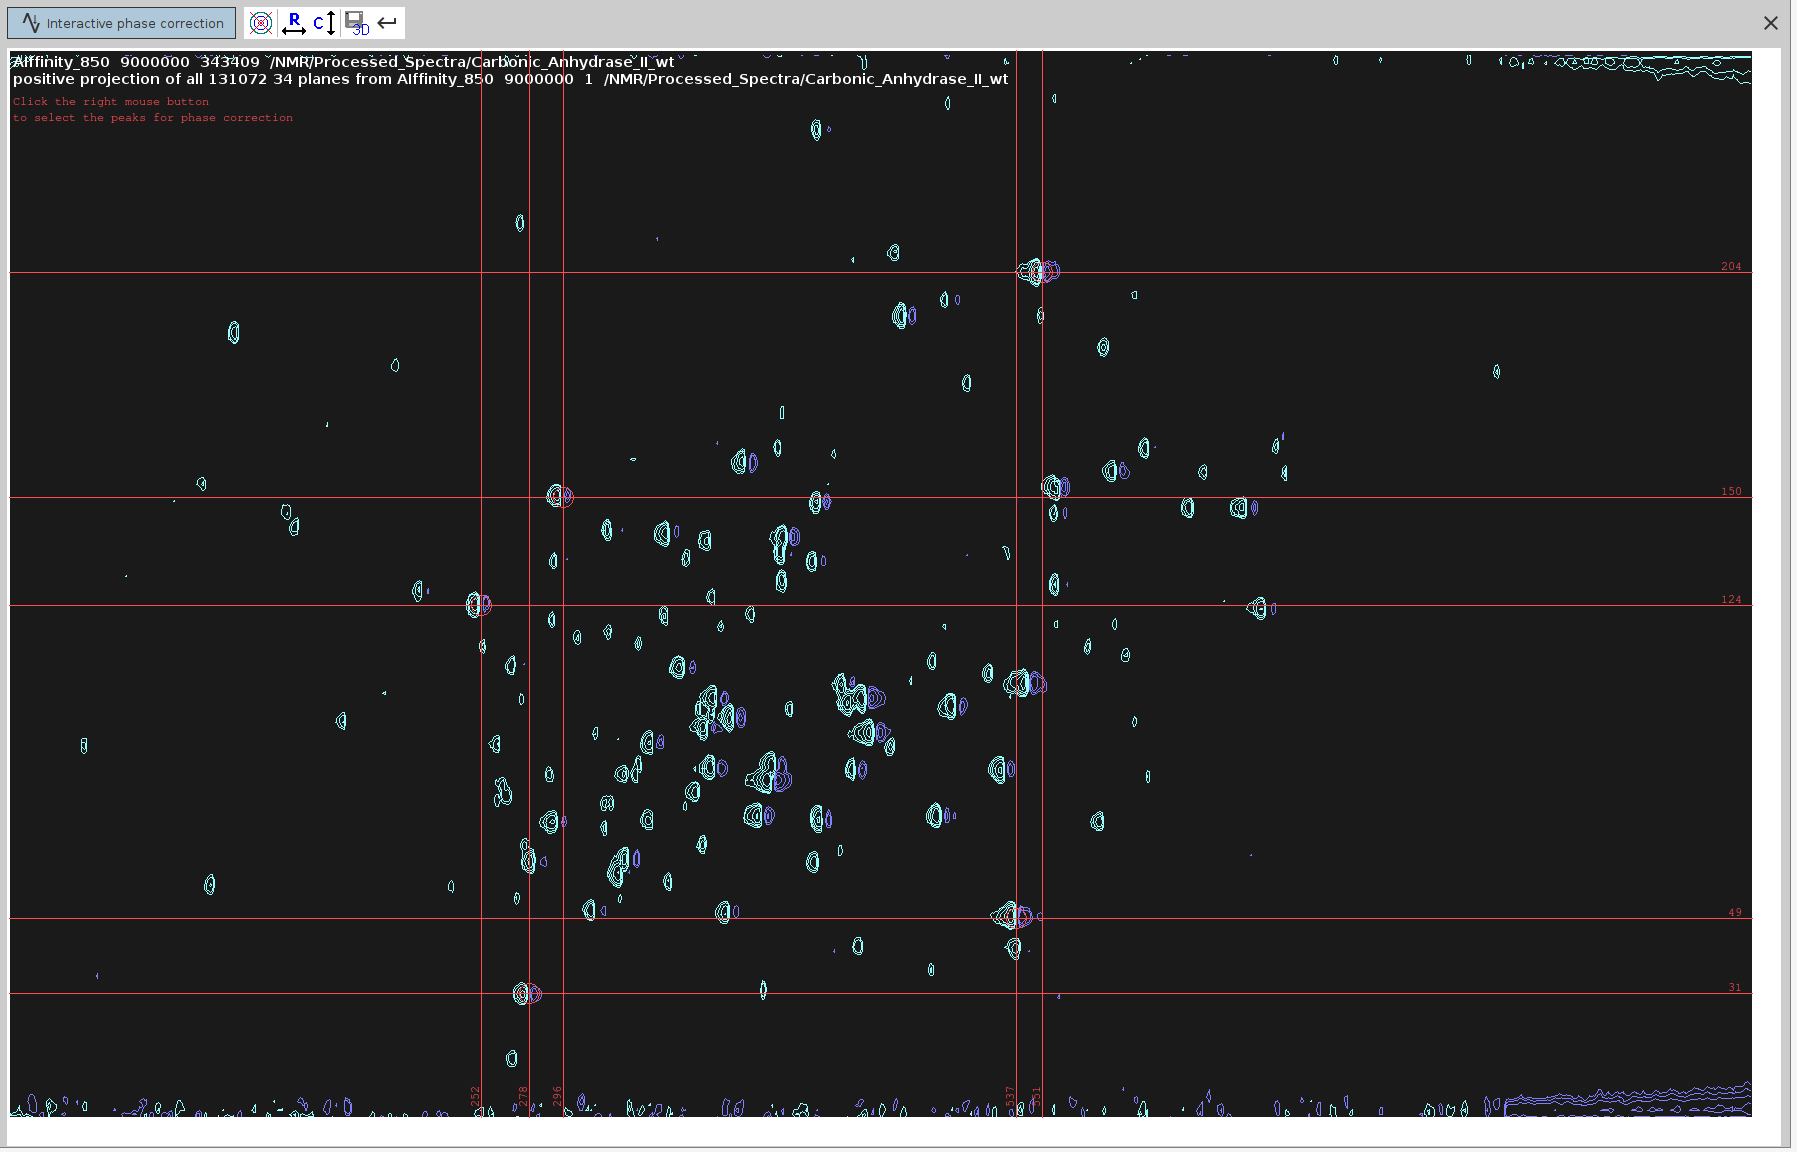
- Switch to phase correction mode for the rows.
- Adjust the
ph0angle to make the strongest signals point upwards and the frequency lines from end to end appear as straight as possible. The optimalph0angle is around-137degrees but the peaks don’t look completely phased.
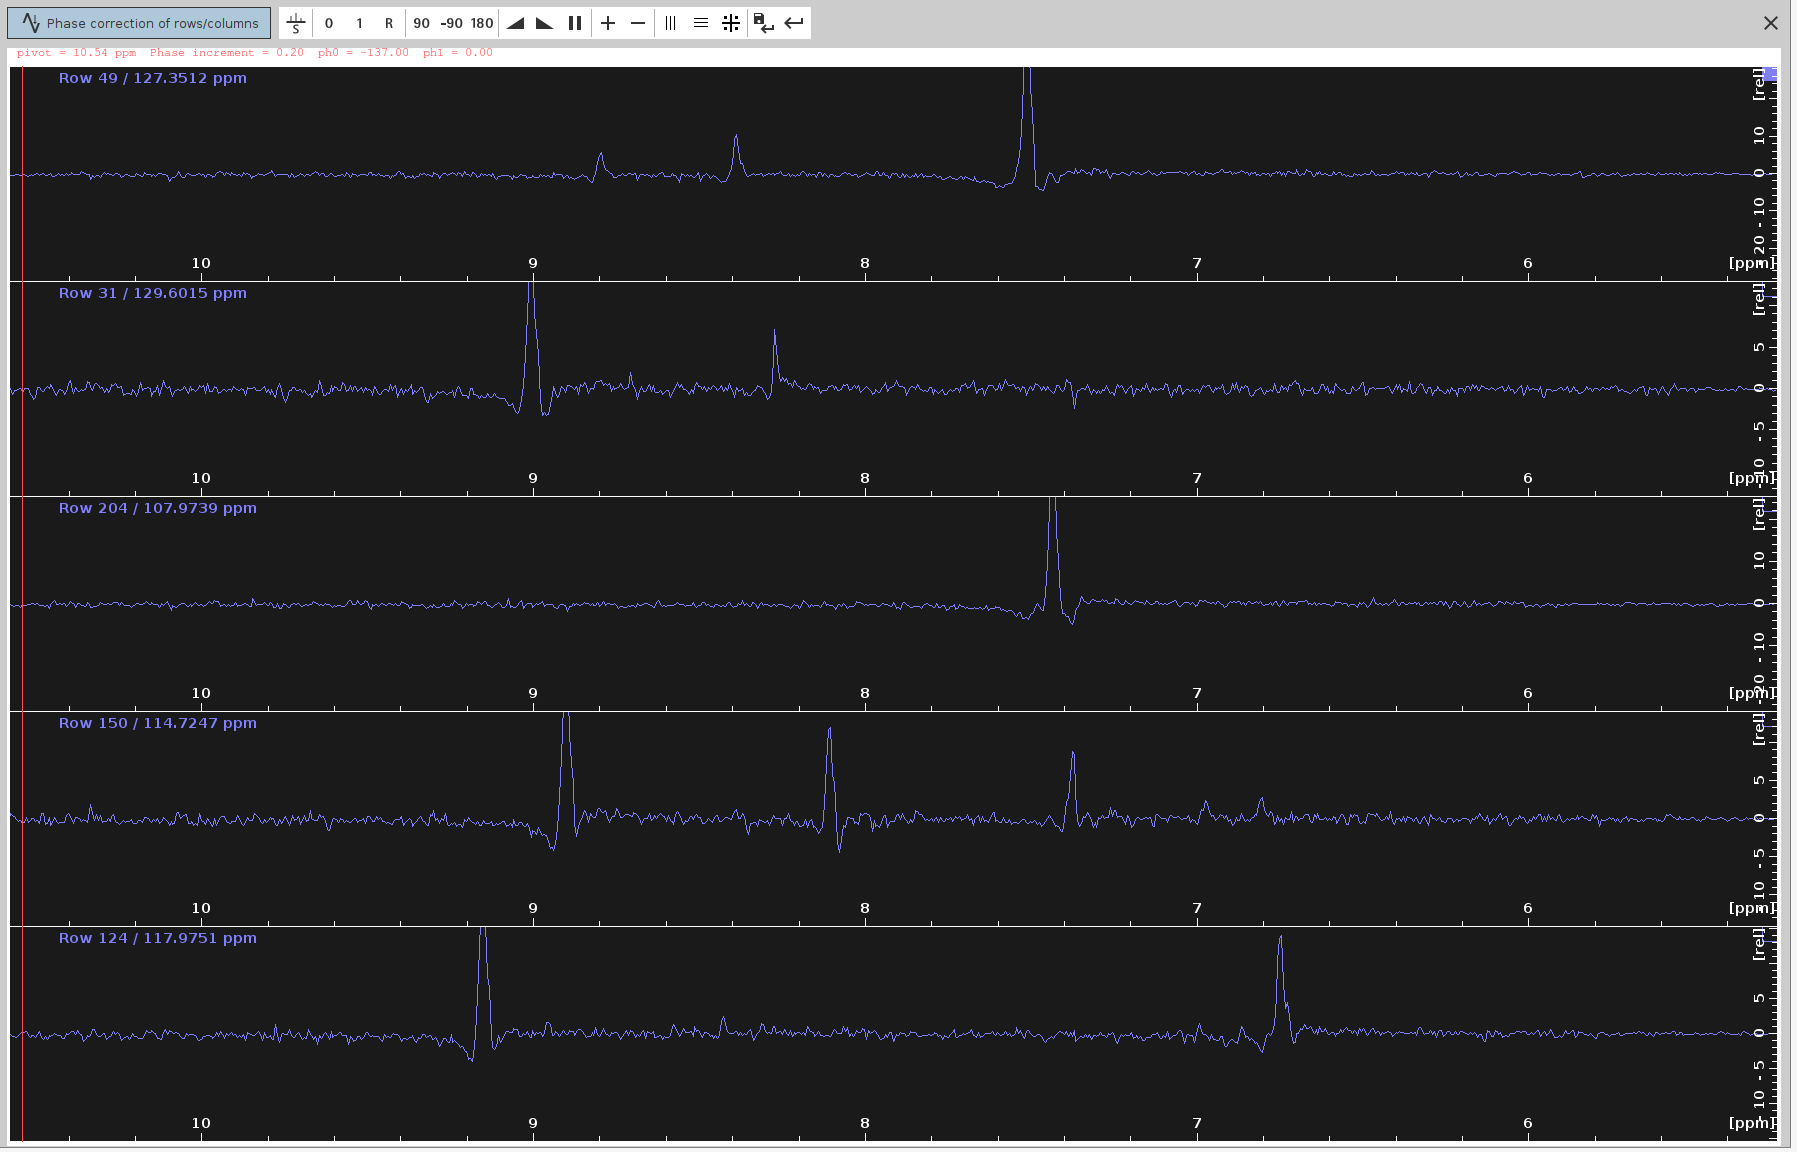
- Note that while the positive signals should now appear stronger, some negative signals were not completely eliminated.
- Apply Phase Correction to 4D:
- Copy the
F4(PHC0)value to the 4D spectrum. - Execute
pknd 4(WARNING: very slow!; may be faster to redoftnd 0orftnd 4)
- Copy the
Baseline Correction
Baseline correction does not have a significant effect on 4D spectra. It should be considered a final touch that does not affect the peak shape.
Authors
- Thomas Evangelidis